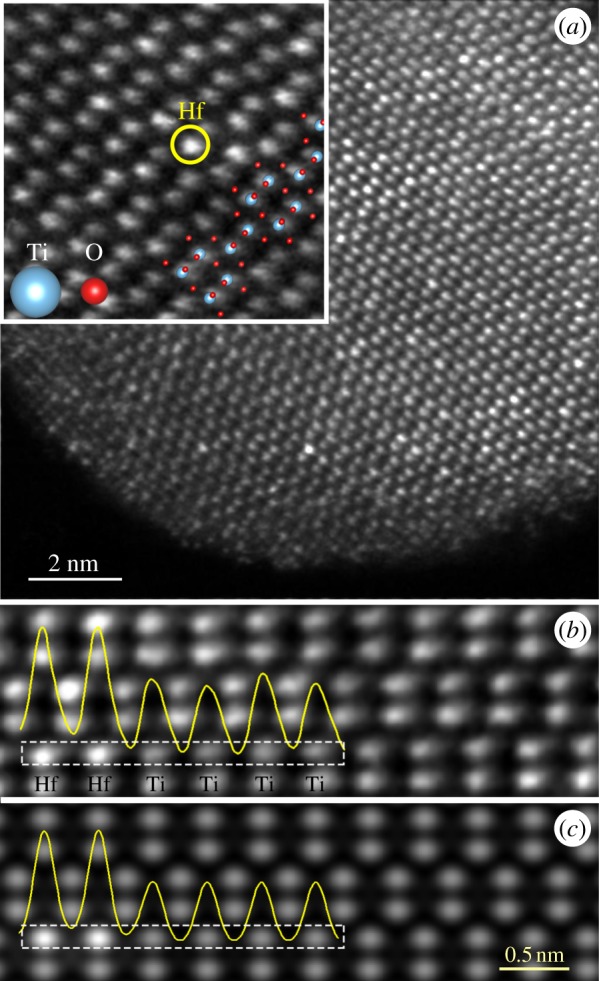
Figure 2.

(a) Z-contrast image of Ti0.95Hf0.05O2 in the (100) orientation with a higher magnification picture (inset) of one individual dislocation core, (b) experimental, and (c) simulated crystal structure of anatase TiO2. The bright spots represent the Ti and Hf columns; pure O columns are not visible.
