Figure 6.

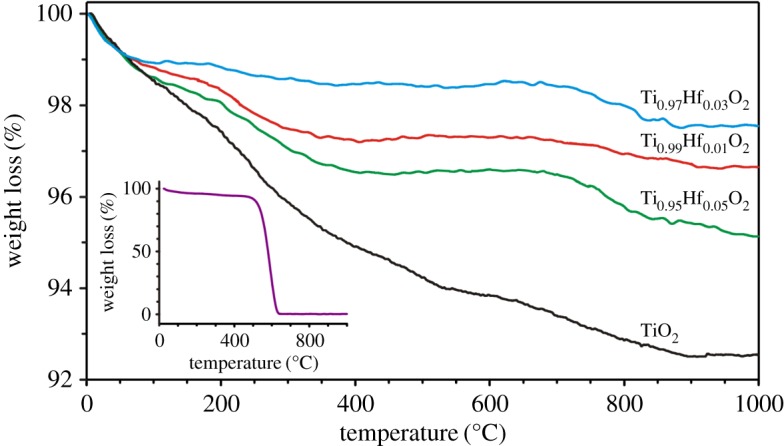
TGA curves for Ti1–xHfxO2 samples with different Hf concentrations as well as for the Busofit-T055 carbon fibre template (inset).

TGA curves for Ti1–xHfxO2 samples with different Hf concentrations as well as for the Busofit-T055 carbon fibre template (inset).