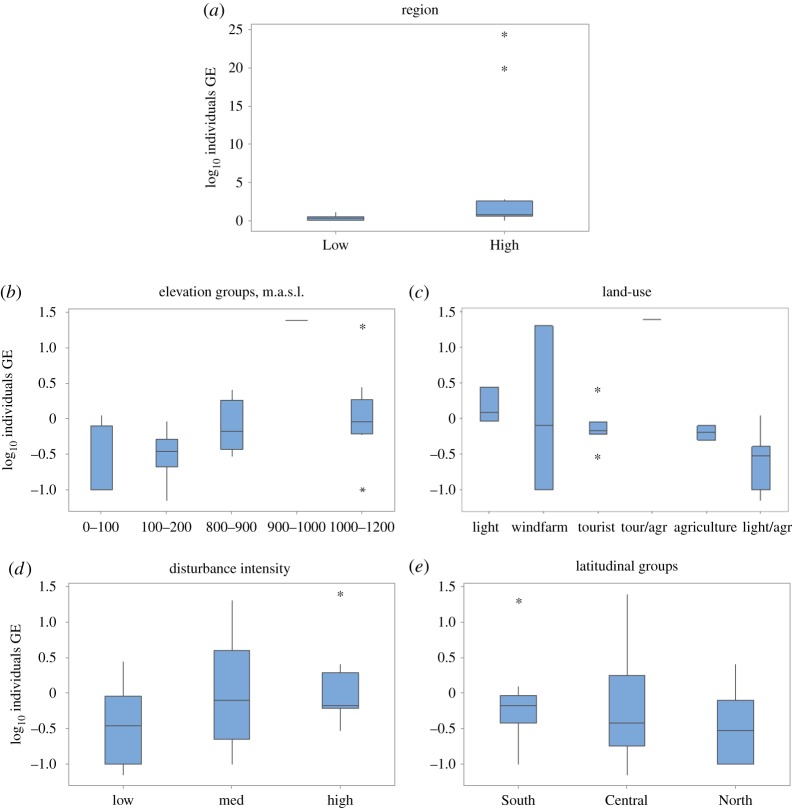
Figure 3.
Log10 transformed GE data for individuals. Quartile 2 and 3 are shaded with the dividing line as the median. The whiskers indicate quartiles 1 and 4. Outliers are indicated by asterisks. (a) Regions (above, High, and below, Low, the Western Ghats escarpment). GLM ANOVA results for the other classes: (b) elevation groups, F = 12.77, d.f.factor = 1, d.f.error = 24, p < 0.01; (c) land-use, F = 10.88, d.f.factor = 1, d.f.error = 24, p < 0.01; (d) disturbance intensity, F = 2.99, d.f.factor = 4, d.f.error = 24, p < 0.05; (e) latitudinal groups, F = 3.33, d.f.factor = 1, d.f.error = 24, p = 0.08.

