
Figure 12.
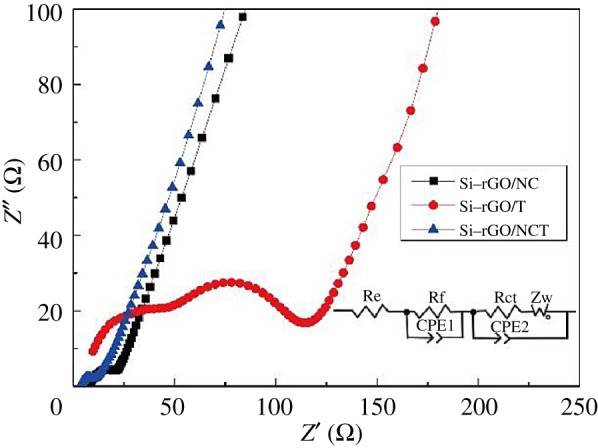
Nyquist plots of Si–rGO/NC, Si–rGO/T and Si–rGO/NCT composite electrodes after 10 cycles with amplitude of 5 mV in the frequency range from 100 kHz to 0.01 Hz, and the equivalent circuit used to model the impedance spectra (inset) [73].
Official websites use .gov
A
.gov website belongs to an official
government organization in the United States.
Secure .gov websites use HTTPS
A lock (
) or https:// means you've safely
connected to the .gov website. Share sensitive
information only on official, secure websites.
Nyquist plots of Si–rGO/NC, Si–rGO/T and Si–rGO/NCT composite electrodes after 10 cycles with amplitude of 5 mV in the frequency range from 100 kHz to 0.01 Hz, and the equivalent circuit used to model the impedance spectra (inset) [73].