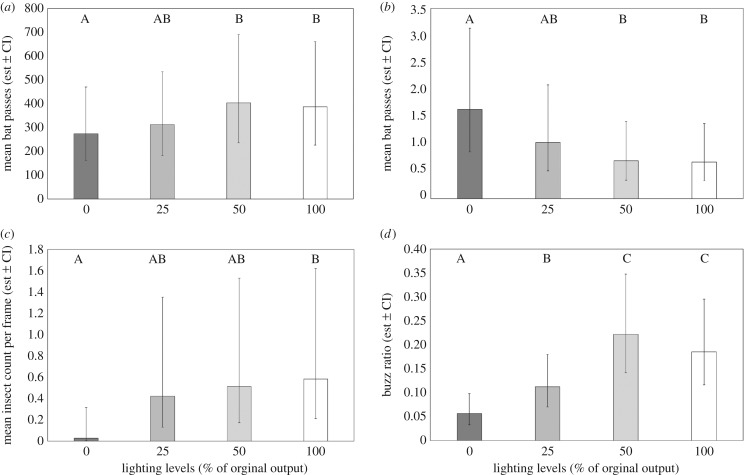
Figure 2.
Mean predicted bat activity (number of bat passes) back-transformed across all sites (n = 21) for each lighting level for (a) Pipistrellus pipistrellus and (b) Myotis spp. (c) Mean predicted insect counts back-transformed across selected sites (n = 7) for each lighting level. (d) Mean predicted buzz ratios back-transformed across all sites (n = 21) for each lighting level. For all graphs letters identify groups that were significantly different from each other and vertical lines denote 95% confidence intervals (CIs).

