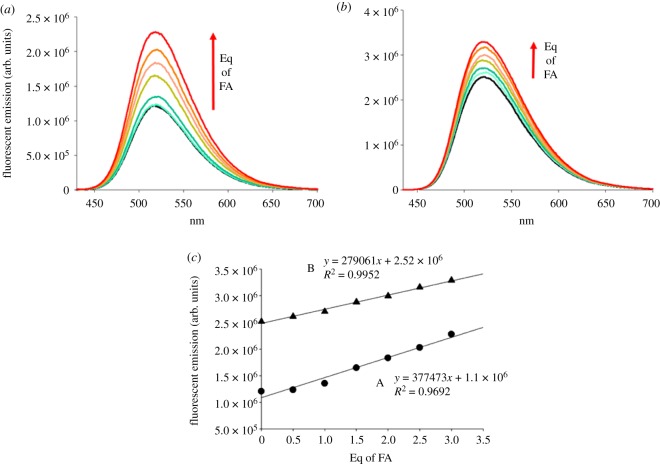
Figure 5.
Fluorescent emission spectra of probe 1 = 10.7 nM (a) and probe 2 = 11.0 nM (b) upon interaction with FA in a 1 : 1 mixture of acetonitrile and water. A linear correlation between the maximum fluorescent emission intensity at 520 nm and the equivalents of FA was obtained in both cases (c), indicating a direct dependence of the fluorescence enhancement on the proton input.

