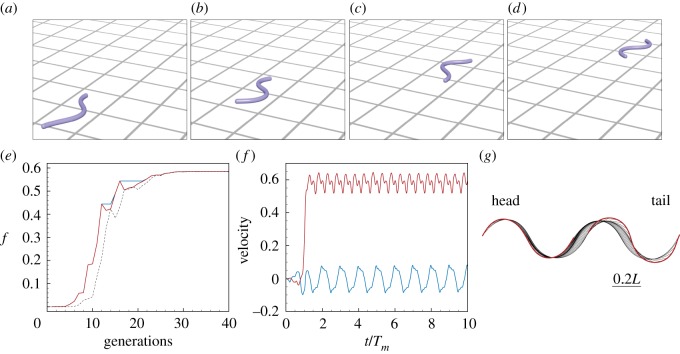
Figure 10.
Optimal lateral undulation gait. (a–d) Instances at different times of a snake characterized by the identified optimal gait. (e) Evolution of the fitness function f=vfwdmax as a function of the number of generations produced by CMA-ES. Solid blue, solid red and dashed black lines represent, respectively, the evolution of f corresponding to the best solution, the best solution within the current generation, and the mean generation value. (f) Scaled forward (red) and lateral (blue) centre of mass velocities versus normalized time. (g) Gait envelope over one oscillation period Tm. Red lines represent head and tail displacement in time. Settings: Froude number Fr=0.1, length L=1 m, radius r= 0.025 m, density ρ=103 kg m−3, Tm=1 s, Young’s modulus E=107 Pa, shear modulus G=2E/3 Pa, shear/stretch matrix N, bend/twist matrix , dissipation constant γ= 5 kg (ms)−1, gravity g=9.81 m s−2, friction coefficient ratios and with , friction threshold velocity , ground stiffness and viscous dissipation kw=1 kg s−2 and γw=10−6 kg s−1, discretization elements n=50, timestep δt=2.5⋅10−5 Tm, wavelength λm=0.97L, phase shift ϕm=0, torque B-spline coefficients βi=0,…,5={0,17.4,48.5,5.4,14.7,0} Nm, bounds maximum attainable torque |β|maxi=0,…,5=50 Nm.

