
Figure 6.
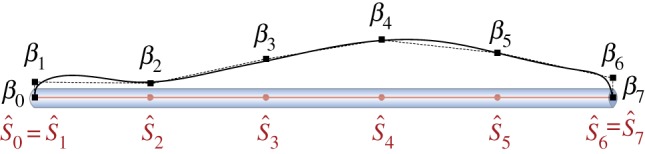
Muscular activity. Example of muscular activity amplitude profile (solid black line) described by cubic B-spline through Nm=8 control points with i=0,…,Nm−1. The control points are located along the filament at the positions , and are associated with the amplitude values βi. The first and last control points are fixed so that and , therefore assuming the ends of the deforming body to be free.