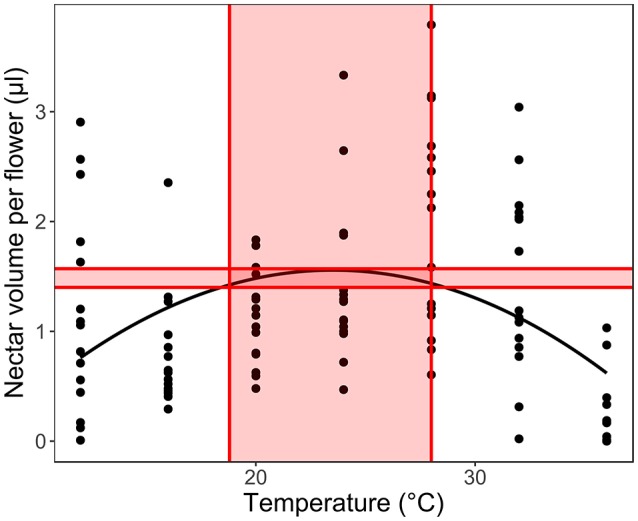
Figure 3.

Calculating the optimal temperature range for each trait in each species. We used 5% of the measured trait value range below the calculated optimum as the optimal production range (shaded area between the horizontal lines) to calculate the optimal temperature range for the given trait (shaded temperature values between the vertical lines).
