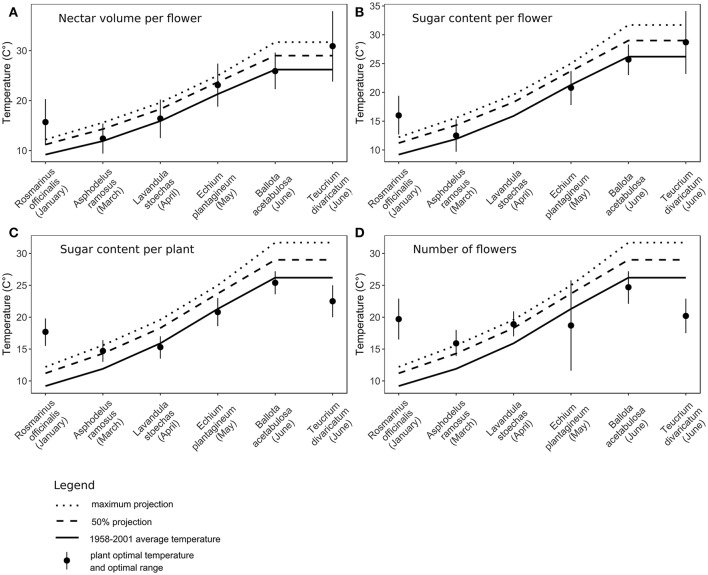
Figure 4.
Comparison of optimal temperatures to past monthly average temperatures and future projections by 2100 (IPCC, 2007, 2013) in six species. Flowering month of each species is noted in the parentheses. (A) Nectar volume per flower, (B) sugar content per flower, (C) sugar content per plant, (D) the number of flowers per plant. For Lavandula stoechas, sugar content per flower (graph B) had a linear relationship to temperature, therefore the optimal temperature could not be calculated.

