Figure 1.
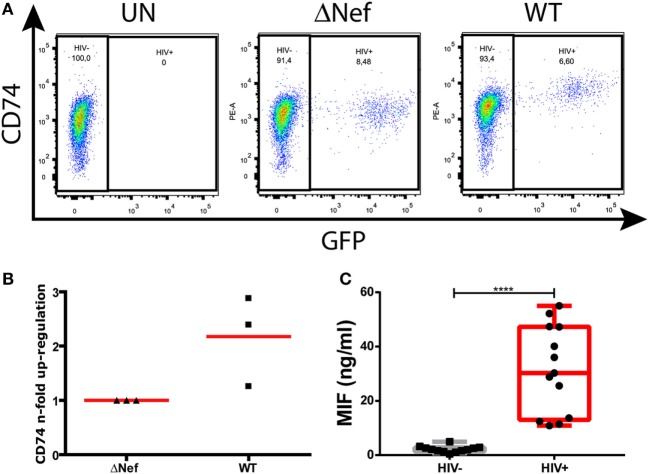
CD74 upregulation in human immunodeficiency virus (HIV)-infected monocyte-derived macrophages (MDMs) and macrophage migration inhibitory factor (MIF) plasma levels in HIV+ subjects. (A) Flow cytometry analysis of CD74 surface expression in primary uninfected MDMs (left panel); infected MDMs with a Nef-defective virus expressing the reporter molecule GFP (ΔNef HIV-1, middle panel); and infected with a wild type (WT) HIV-1 also expressing the reporter molecule GFP (WT HIV, right panel). The plots show CD74 versus GFP expression (HIV-1 infection) on MDMs [gated previously in a forward scatter (FSC) versus side scatter plot]. In each dot plot, two different populations were gated: the HIV-1 negative population (GFP negative) and the HIV-1 positive population (GFP positive). One representative healthy donor, out of three donors, is shown. (B) Quantitation of Nef-mediated upregulation of CD74, calculated as the ratio between FL-2 MFI obtained for cells infected with the WT virus and the FL-2 MFI obtained for cells infected with the ΔNef virus. Each black dot represents one out of three independent experiments (donors). Horizontal red bars stand for the mean value. (C) MIF concentration in plasma obtained from HIV-negative (HIV−, N = 13) and HIV-positive (HIV+, N = 13) donors. Each plasma was evaluated in duplicate. Dots represent the average of duplicates for each donor. Data were normally distributed and analyzed by two-tailed unpaired Student’s t-test. Horizontal lines within boxes represent the median and whiskers extend from min to max. ****p < 0.0001.

