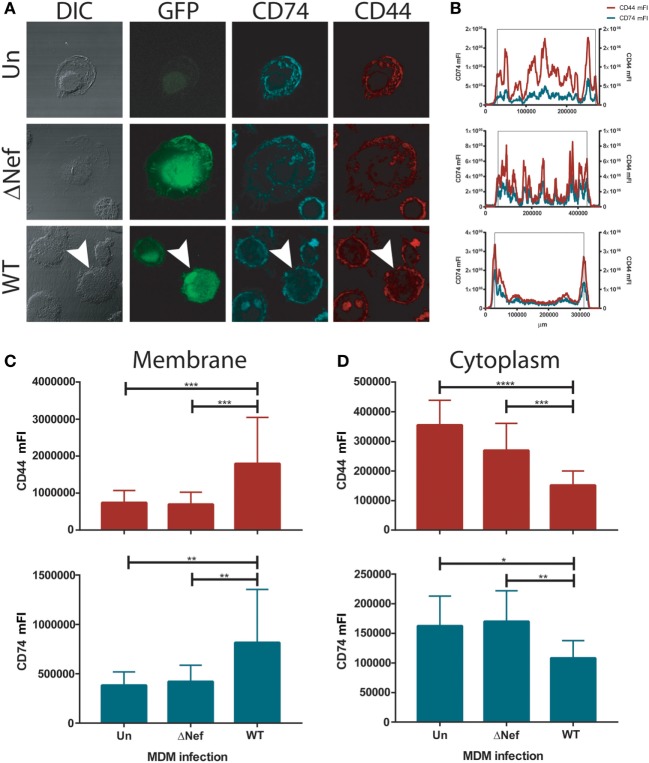
Figure 2.
CD74 and CD44 expression in uninfected and infected monocyte-derived macrophages (MDMs). (A) Confocal immunofluorescence microscopy of primary uninfected MDMs (UN, upper panels); primary ΔNef human immunodeficiency virus (HIV)-infected MDMs (ΔNef, middle panels); and primary wild type (WT) HIV-infected MDMs (WT, lower panels). From left to right: bright field, GFP (HIV-1 infection), CD74 staining and CD44 staining are shown, in one representative cell for each condition. (B) Plots show cross-sectional mean fluorescence intensity (mFI) for CD74 (left axis, cyan line) and CD44 (right axis, red line) corresponding to the depicted cells (in the lower panel, cross-sectional mFI was evaluated in the cell pointed with an arrow). The black lines indicate the area comprising the cell according to the DIC. (C,D) Cross-sectional mFI quantification for CD44 (upper panel) and CD74 (lower panel) intensity at plasma membrane (C) and cytoplasm (D). Quantifications were performed in 15 individual cells for each condition. Bars represent mean ± SD. Data were analyzed by one-way ANOVA followed by Dunnett’s post-test. *p < 0.05, **p < 0.01, ***p < 0.001, ****p < 0.0001.

