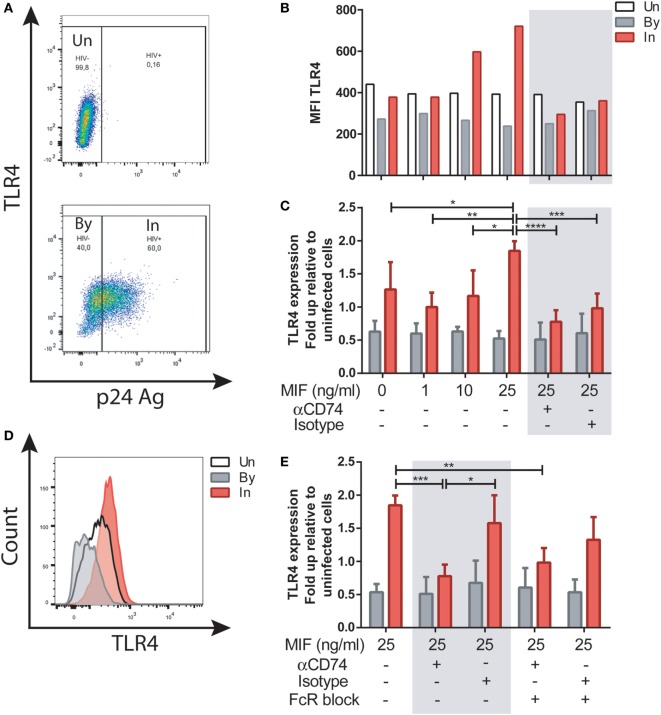
Figure 3.
TLR4 expression after macrophage migration inhibitory factor (MIF) stimulation in primary human immunodeficiency virus (HIV)-infected monocyte-derived macrophages (MDMs). (A) TLR4 expression in uninfected (UN, upper panel), bystander (By, lower panel), and productively infected cells identified on the bases of intracellular p24 staining (In, lower panel). Living MDMs were gated previously on a forward scatter versus side scatter dot plot. An isotype-matched FITC-conjugated antibody was used to accurately set the p24-negative population. (B) TLR4 MFI in uninfected MDMs (Un), in productively infected MDMs (p24 positive population within the well inoculated with the virus, In) and in the bystander uninfected MDMs (p24-negative population within the well inoculated with the virus, By) after MIF treatment. These data represent the results obtained from one representative donor. (C) Ratio between the TLR4 MFI of the infected (or bystander population) and the TLR4 MFI of the uninfected cells after treatment with MIF, with or without CD74 blockade with an anti-CD74 antibody. Fold up from four independent donors, evaluated in duplicate are shown collectively. Data represent the mean ± SD. (D) Flow cytometry histogram overlay for TLR4 expression on Un, By, and In MDMs all treated with 25 ng/ml MIF (E) Ratio between the TLR4 MFI of the infected (or by-stander population) and the TLR4 MFI of the uninfected cells using the different CD74-blocking conditions represented in the x-axis. Data were analyzed by two-way ANOVA followed by Tukey’s post-test. *p < 0.05, **p < 0.01, ***p < 0.001, ****p < 0.0001.

