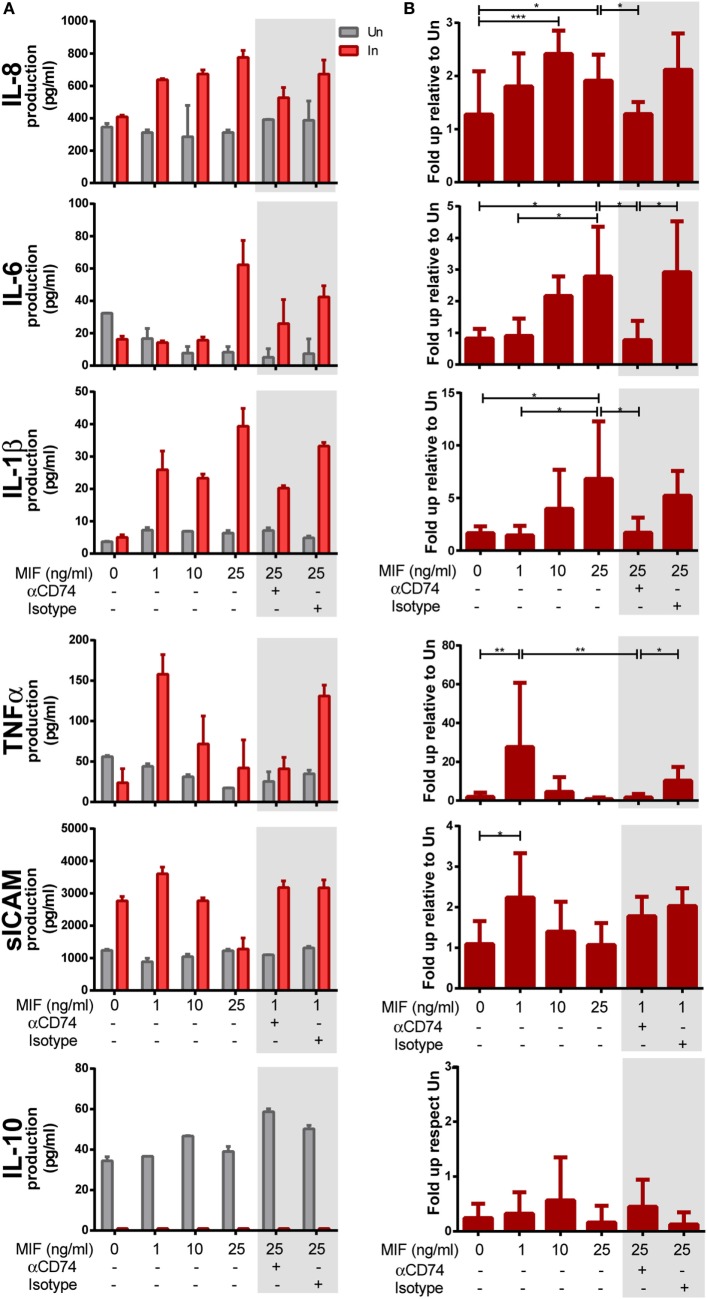
Figure 4.
Expression of cytokines after macrophage migration inhibitory factor (MIF) stimulation in primary human immunodeficiency virus (HIV)-infected and uninfected monocyte-derived macrophages (MDMs). (A) Expression of IL-8, IL-6, IL-1β, TNF-α, sICAM, and IL-10 in supernatants from HIV-infected (In) and uninfected (Un) MDMs obtained from one representative healthy donor. (B) Data combined from six independent experiments (donors), each evaluated in triplicate. Here, data are shown as the ratio between cytokine concentrations found under the infection condition versus the uninfected counterpart. Cells were stimulated with MIF as follows: 0, 1, 10, or 25 ng/ml. Data shown in the gray boxes depict CD74 blocking (10 ng/ml of αCD74 or the corresponding isotype control) followed by MIF stimulation (1 or 25 ng/ml as denoted). Data represent the mean ± SD. Data were analyzed by one-way ANOVA followed by Tukey’s post-test. *p < 0.05, **p < 0.01, ***p < 0.001.

