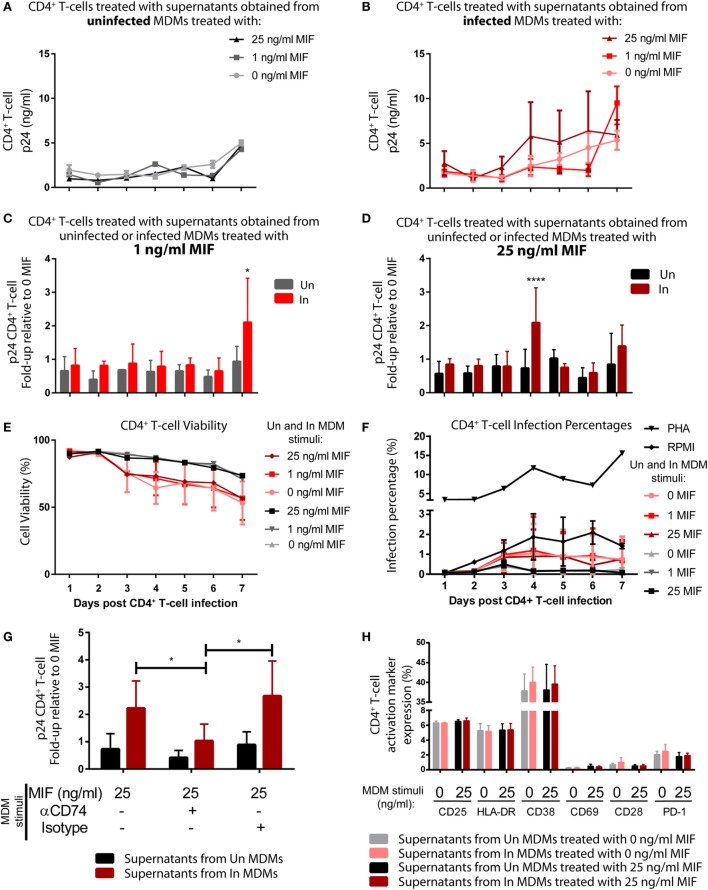
Figure 6.
Induction of permissiveness to human immunodeficiency virus type I (HIV-1) infection in primary CD4+ T-cells after stimulation with macrophage migration inhibitory factor (MIF)-treated monocyte-derived macrophages (MDMs)-derived supernatants. (A,B) Seven-day kinetics of HIV p24 antigen production from primary unactivated CD4+ T-cell incubated with supernatants from uninfected (A) and infected (B) MDMs treated with 0, 1, or 25 ng/ml MIF. (C,D) Ratio of p24 production from unactivated CD4+ T-cell incubated with supernatants from uninfected MDMs and infected MDMs treated with 1 ng/ml MIF (C) or 25 ng/ml MIF (D) over the no-MIF condition. (E) Percentage of living CD4+ T-cells stimulated with supernatants derived from uninfected (black, dark gray, and light gray lines) and infected (pink, red, and dark red lines) MDMs. (F) Percentage of infected (GFP+) CD4+ T-cells after stimulation with MDM-derived supernatants obtained from MIF-treated uninfected MDMs (black, dark gray, and light gray lines), infected (pink, red, and dark red lines) MDMs, RPMI (negative control, black line with diamonds), or PHA (positive control, black line with triangles). (G) Ratio of p24 production from unactivated CD4+ T-cell incubated with supernatants from uninfected MDMs and infected MDMs treated with 25 ng/ml MIF, with or without CD74 blockade with an anti-CD74 antibody. (H) Expression of surface markers on CD4+ T-cells subjected to 72 h stimulation with supernatants derived from infected and uninfected MDMs and exposed or not to MIF treatment (0 and 25 ng/ml MIF). Data represent the mean ± SD from six independent donors evaluated in duplicate. In (C,D), data were analyzed by two-way ANOVA followed by Sidak’s post-test. In (G), data were analyzed by two-way ANOVA followed by Tukey’s post-test. *p < 0.05, ****p < 0.0001.

