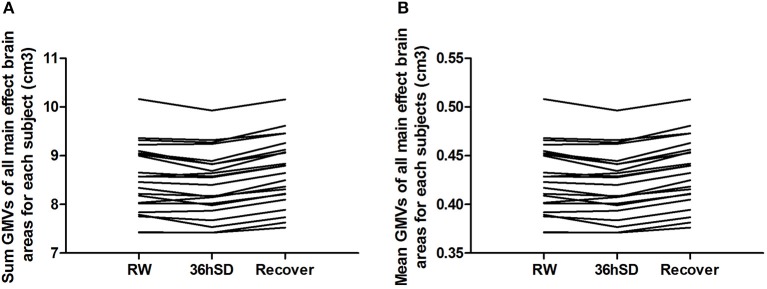
Figure 4.
Sum and mean gray matter volume (GMV) of all main effect brain areas for each subject in the 36 h sleep deprivation (SD) study. In all subjects, from rested wakefulness (RW) to 36 h SD and from 36 h SD to one night sleep recovery, the total (A) and mean (B) GMV in the main effect brain areas showed a tendency of reduction first and then increase.

