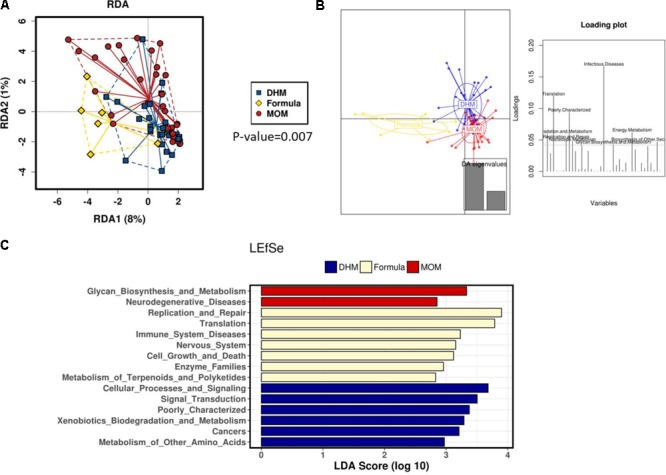
FIGURE 5.

RDA plot (A). Discriminant analysis of principal components (DAPC) plot and loading plot (B) at KEGG pathways. The individual peaks in the loading plot show the magnitude of the influence of each variable on separation of the groups (0.05 threshold level). LEfSe test (C) revealed distinct clustering of the MOM (red), DHM (blue), and formula-fed group (yellow).
