
Figure 5.
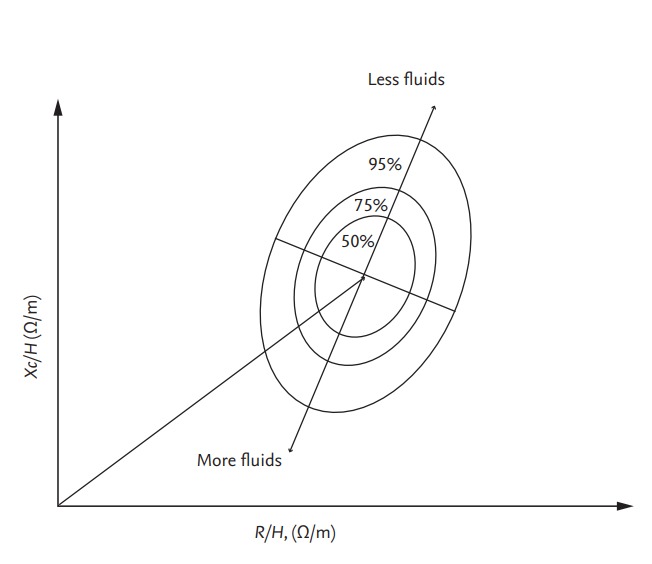
R and Xc, normalized for height, are plotted on the RXc graph with elliptical probability regions (50%, 75%, and 95% tolerance ellipses). Vector movement along the major axis of ellipses means changes in hydration status. Modified from Piccoli, with permission of Karger Publishers [41]. R, resistance; Xc, reactance; H, height.