Figure 2.

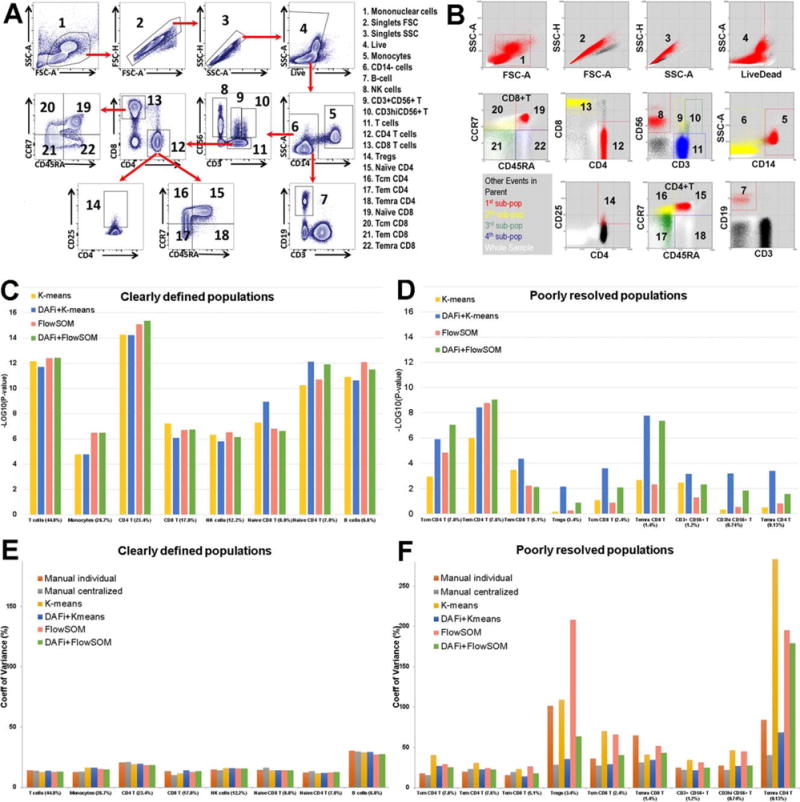
Results of DAFi using K-means and FlowSOM in comparison with individual and centralized manual gating analysis. (A) Illustration of the manual gating hierarchy for identifying the 22 predefined cell populations from the 10-color T cell panel, with gating boundaries shown on each 2D dot plot. Along the direction of the red arrows is the sequence of the gates with their parent populations. The cell populations are numbered. Names of the cell types are listed to the right. (B) Results of DAFi using K-means for identifying the corresponding 22 predefined cell populations. Events from the whole sample are colored in white. The black colored dots are events of the parent population, with events identified by DAFi highlighted in red, yellow, green, and blue. (C) Linear regression analysis of percentages of clearly defined cell populations identified by the K-means and the FlowSOM data clustering methods with and without DAFi compared with centralized manual gating. X axis: cell populations sorted based on their average percentage, from the largest to the smallest. Y axis: P values (–log10 transformed) of x-variable in linear regression analysis between percentages of the cell populations identified by four computational methods and the centralized manual gating analysis. (D) Linear regression analysis of percentages of poorly resolved cell populations identified by the K-means and the FlowSOM data clustering methods with and without DAFi compared with centralized manual gating. (E) CV of population percentages across the 24 samples for clearly defined cell populations by six different approaches. (F) CV of population percentages across the 24 samples for poorly resolved cell populations by the six different approaches. [Color figure can be viewed at wileyonlinelibrary.com]
