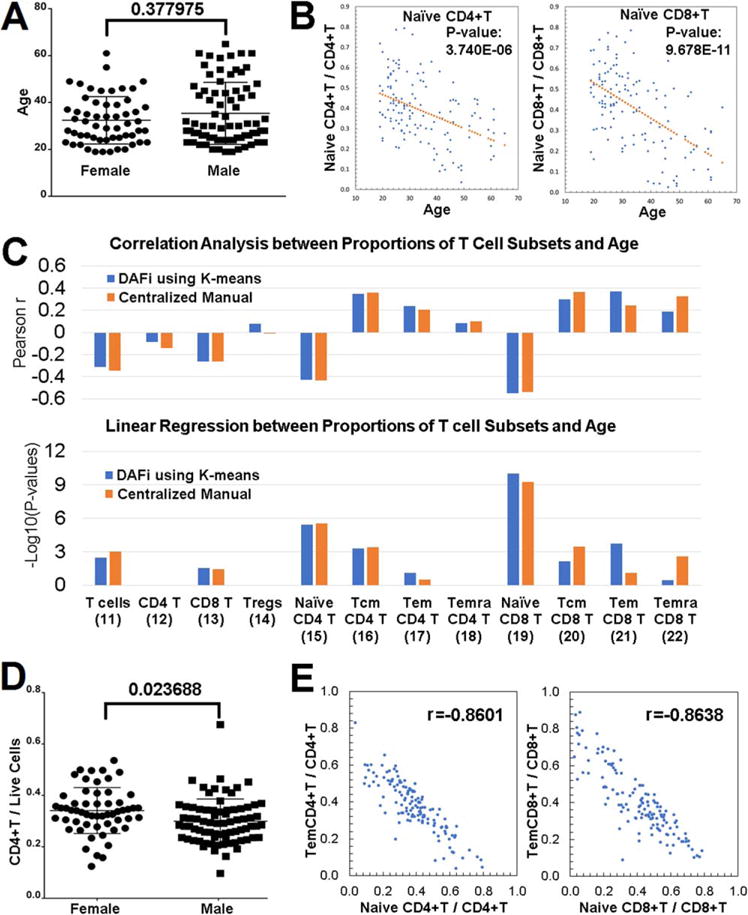
Figure 3.

Correlation analysis of DAFi-defined cell population proportions with subject age and gender. (A) Age distribution of participants separated by gender. (B) Proportions of Naïve CD4+ T and Naïve CD8+ T cells (with CD4+ and CD8+ T cells as parents, respectively) versus age with linear regression P values reported. (C) Pearson correlation and linear regression analysis of proportions of T cell subsets with subject age. Parent population definitions of the T-cell subsets can be found in Figure 2A. P values of x-variable in linear regression analysis were –log10 transformed and multiple comparison corrected by Bonferroni correction. (D) Proportion of CD4+ T cells in female and male participants. (E) Correlation between the proportions of effector memory T cells versus Naïve T cells. [Color figure can be viewed at wileyonlinelibrary.com]
