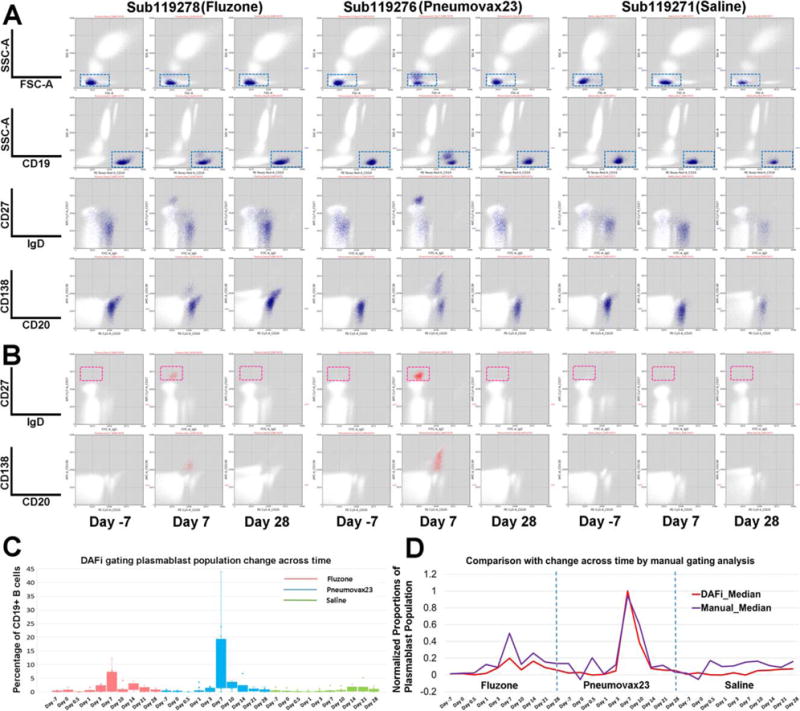
Figure 4.

Quantification of human immune response to influenza and pneumococcal vaccination using DAFi. From left to right under each vaccine/saline treatment are three selected time points from one individual in each treatment group: 7 days before the treatment (Day 7), and Day 7 and Day 28 after treatment. (A) CD19+ B cells were identified by DAFi using the 2D rectangular gates in FSC/SSC-A and CD19/SSC-A plots illustrated in the first two rows. The two following rows show the B cell events (colored in blue) on IgD versus CD27 and CD20 versus CD138 dot pots. (B) Plasmablast cells identified by DAFi from the CD19+ B cell population. The plasmablasts, defined as IgD−CD27hi, are shown in the red box. (C) Percentage of plasmablast cells (with CD19+ B cell as parent) identified across times and treatment groups by DAFi in box plots. (D) Normalized proportions of the plasmablast population (with CD19+ B cell as parent) identified by DAFi and manual gating analysis across times and treatment groups. [Color figure can be viewed at wileyonlinelibrary.com]
