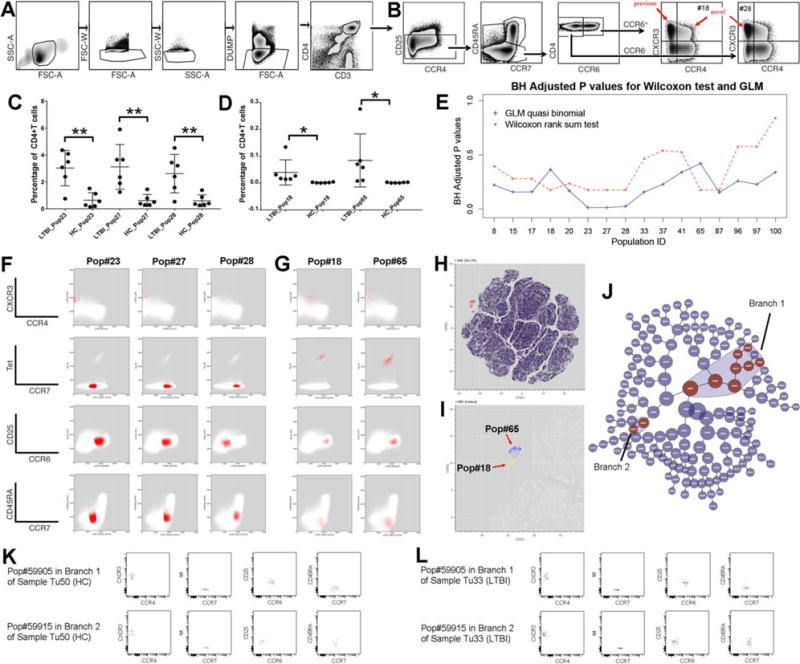
Figure 5.

Identification of known and novel cell-based biomarkers for LTBI using constrained FLOCK clustering of DAFi filtered populations. (A) Manual gating strategy for identifying CD4+ T cells. The gating path sequentially identifies lymphocytes (FSC-A vs. SSC-A), singlet lymphocytes based on FSC-A/W, singlet lymphocytes based on SSC-A/W, live CD8− T lymphocytes (the DUMP channel includes CD8/CD14/CD19/LiveDead), and CD3+CD4+ T lymphocytes. (B) Manual gating strategy for identifying subset populations from the CD4+ T cells, based on CD25, CCR7, CD45RA, CCR4, CCR6, and CXCR3 expression. (C) Percentages of the three cell subsets (CD4+ T cell population as parent) that have P values < 0.05 (annotated with **) after BH correction identified by the GLM with quasi binomial distribution, between LTBI and HC. (D) Percentages of the two Tetramer+ cell populations which should only be found in the samples of LTBI. (E) Two types of statistical tests were applied to identify which CD4+ T cell subsets are significantly different in abundance between LTBI and HC. The X axis shows the IDs of the cell populations with P values < 0.05 by either statistical test before BH correction. The Y axis shows the P values after BH correction. (F) 2D dot plots of the three CD4+ T cell subsets (percentages shown in part C of this Figure) that differ between LTBI and HC. (G) The two Tetramer+ cell subsets (percentages shown in part D of this Figure) with their events highlighted in red on 2D plots of different markers. Both are very rare (average < 0.1% of CD4+ T cells). (H) t-SNE map of the filtered data. CD4+ T cells are color-coded based on expression level of tetramer to highlight the tetramer+ population in the mid-upper left region. (I) Zoomed-in tSNE map shows that the “island” of the tetramer+ population consists of two separated regions, corresponding to the Pop#18 (highlighted in yellow) and the Pop#65 (highlighted in blue). (J) The hierarchy of cell populations identified by the Citrus method. Cell populations that are significantly different between the LTBI and the HC groups are highlighted in red, which belong to two branches: Branch 1 (8 cell populations) and Branch 2 (2 cell populations). (K) One example sample in the HC group showing the two cell populations with the best P values generated by the Citrus method from Branch 1 and Branch 2, respectively. (L) One example sample in the LTBI group showing the two cell populations with the best P values generated by the Citrus method from Branch 1 and Branch 2, respectively. [Color figure can be viewed at wileyonlinelibrary.com]
