
Figure 3. Akt/β-catenin/survivin signaling pathways downregulated by miR-342 and miR-363.
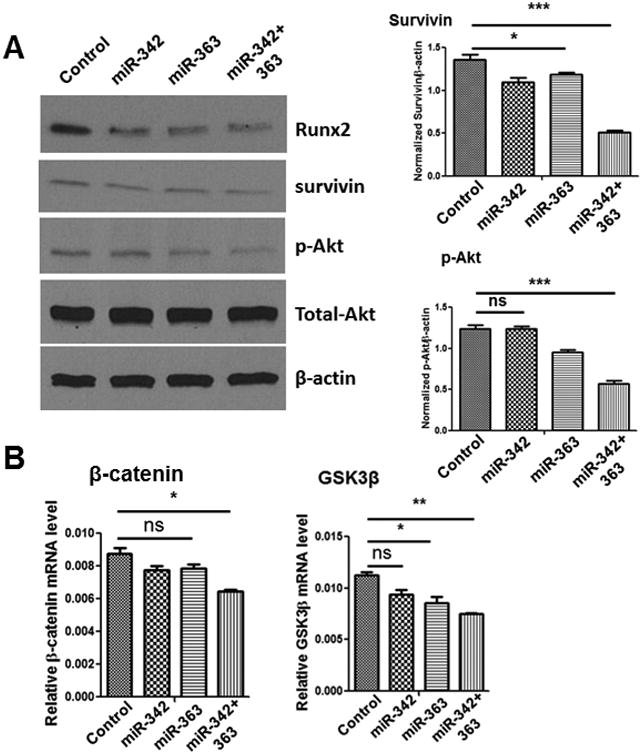
(A) Representative Western blot showing the relative expression of Runx2, survivin, and p-Akt in CAG cells transfected with miR-Scramble control, miR-342, miR-363, or miR-342+363 (left). Survivin and p-Akt expression levels were quantified and normalized to β-actin levels using ImageJ software (right). (B)Relative expression of Wnt-signaling pathway components β-catenin and GSK3β in CAG cells transfected with miR-Scramble control or miR-342, miR-363, or miR-342+363 mimics, measured by RT-qPCR. The P values were obtained by one-way ANOVA followed by Tukey-Kramer post hoc test (ns: non-significant; *P<0.05; **P<0.005; ***P<0.0001).