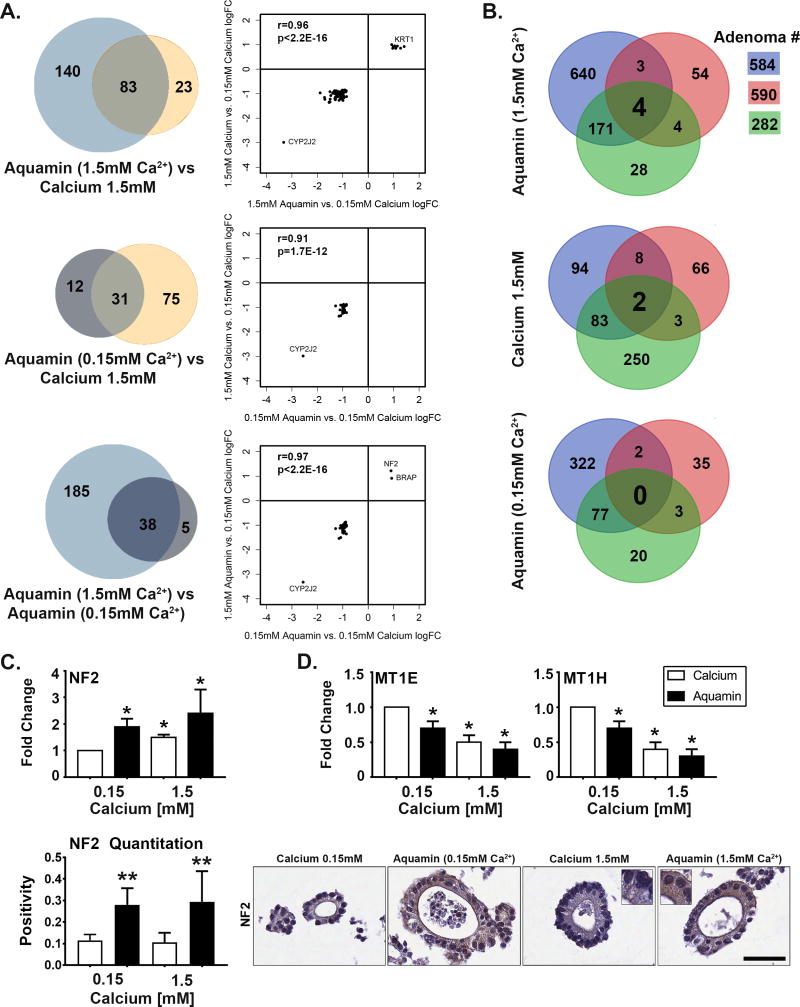
Figure 4. Proteomic profile in adenoma colonoids.
At the end of the 30-day incubation period, lysates were prepared for proteomic analysis. Figure 4A: Venn plots showing proteins altered (increased or decreased) by an average of 1.8-fold or greater across all three adenomas in response to each intervention and the overlap between pairs of interventions. The scatterplots demonstrate quantitative relationships between individual proteins altered by each pair of interventions. Figure 4B. Overlap in proteins altered (increased or decreased) with each intervention by 1.8-fold or greater in each of the three adenomas. Figure 4C. NF2 (merlin): Values in the upper bar graph represent fold-change under each condition relative to control. Values are means and standard deviations based on the proteomic assessment of the three adenomas. Asterisks indicate statistical significance from control at p<0.05 level. Values in the lower bar graph are based on the quantitation of immunostaining (measured using Positive Pixel Value v9) and show strong up-regulation in colonoids exposed to Aquamin® at both 0.15 and 1.5mM but little response to calcium. Two asterisks indicate statistical significance relative to calcium at 1.5 mM and control. Insert: NF2 (merlin) stained colonoids. Bar=50μm. Figure 4D. Metallothionines (MT1E and MT1H). Values represent fold-change and are means and standard deviations based on the proteomic assessment of the three adenomas. Both proteins were down-regulated in colonoids exposed to Aquamin® (at 0.15 and 1.5mM) and calcium at 1.5mM. Asterisks indicate statistical significance from control at p<0.05 level.

