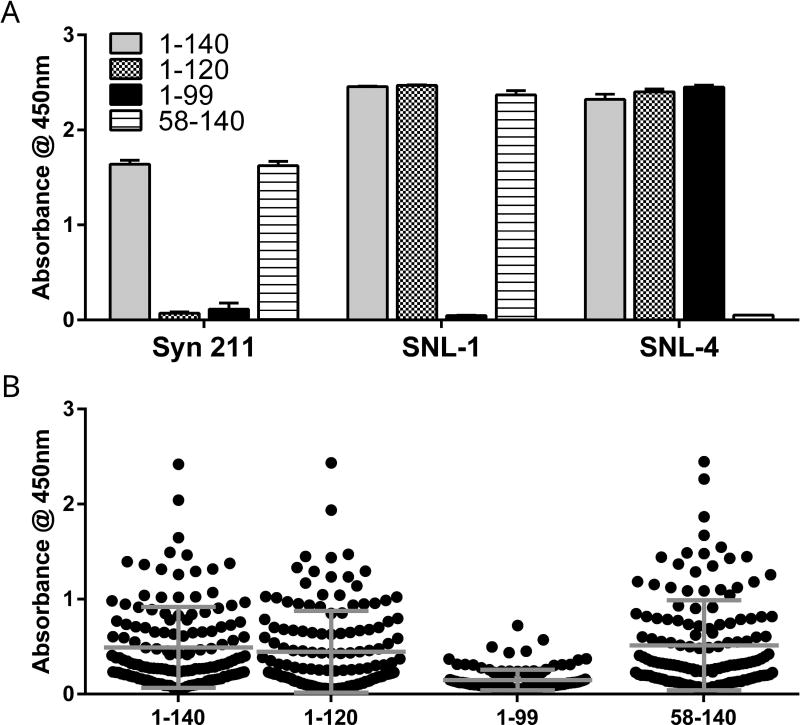
Figure 9. Recruitment of CSF α-syn auto-antibodies is reduced by select C-terminal truncation of α-syn.
Full-length or truncated α-syn were adsorbed for ELISA. (A) Mouse monoclonal antibody Syn 211 or rabbit polyclonal antibodies SNL-1 and SNL-4 did not detect α-syn in which truncations removed the binding epitope of each antibody. There was no significant difference in absorbance between the two preparations (full length and a.a 58–140) detected by Syn 211 (p = 0.69). SNL-1 detected slightly less of the N-terminal truncated α-syn than either the full-length or the a.a. 1–120 preparation (p = 0.016 and p = 0.008) (overall effect F2,6 = 12.84, p = 0.007 by one-way ANOVA when excluding a.a. 1–99). SNL-4 detected slightly more of the a.a. 1–99 preparation than full-length (p = 0.013) but there was otherwise no difference between full-length and a.a. 1–120 or between a.a. 1–120 and a.a. 1–99 (overall effect F2,6 = 9.23, p = 0.015 by one-way ANOVA when excluding a.a. 58–140). Each column represents mean ± standard deviation of three technical replicates (n=3 wells). (B) CSF α-syn AAb levels were significantly lower when C-terminal truncated (a.a. 1–99) α-syn was used in ELISA as compared to full-length α-syn (p < 0.001), partial C-terminal truncated α-syn (a.a. 1–120, p < 0.001), or N-terminal truncated α-syn (a.a. 58–140, p < 0.001), (overall effect F3,564 = 27.32, p < 0.0001 by one-way ANOVA). There was no significant difference in average CSF α-syn AAb levels detected by full-length vs a.a 1–120 (p = 0.75), full-length vs a.a. 58–140 (p = 0.96), or a.a 1–120 vs 58–140 (p = 0.44). Each data point depicts mean of three samples per assay, each assay having three technical replicates (n=9 wells). Horizontal lines depict mean and standard deviations

