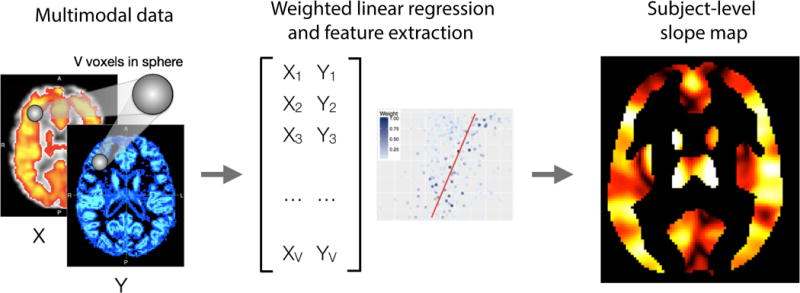
Figure 2.

The inter-modal coupling (IMCo) pipeline is shown below. Both X, Y, and the subject-level map are for illustrative purposes only and do not depict data collected. We create IMCo for each pair of imaging modalities allowing each modality in the pair to be Y on X and X on Y. The MIMoSA model utilized the intercepts and slopes generated as features therefore we calculate 2 subject-level maps. While the subject-level map is for illustrative purposes, the coloring represents spatial variability where some regions have higher versus lower slopes or intercepts within subject.
