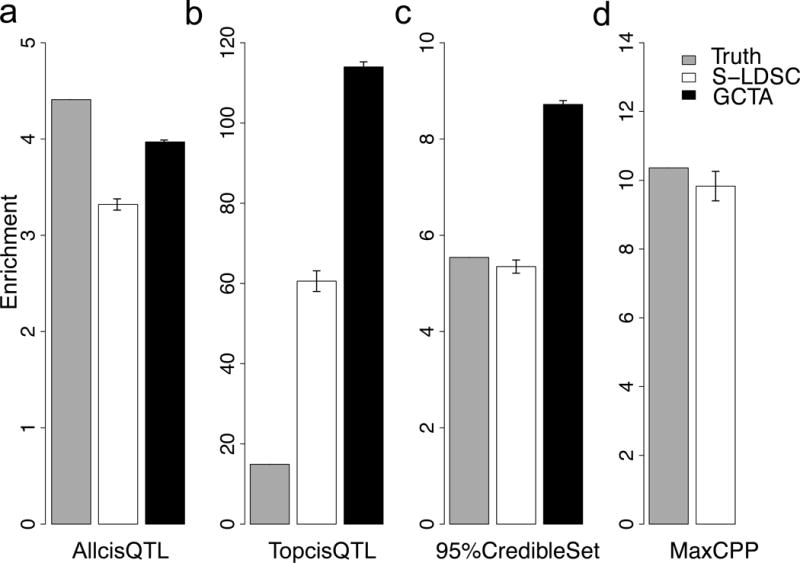
Figure 1. S-LDSC and GCTA estimate for TopcisQTL are upward biased in simulations.

Panels (a), (b), (c), and (d) illustrate the true enrichment and S-LDSC and GCTA enrichment estimates for AllcisQTL, 95%CredibleSet, TopcisQTL, and MaxCPP annotations, respectively. GCTA is not applicable to continuous annotations (MaxCPP). The Y-axis indicates the mean of enrichment and error bars represent 95% confidence intervals that are computed for 400 simulations. Numerical results are reported in Supplementary Table 2. See Supplementary Table 3 and Supplementary Table 4 for additional simulation scenarios.
