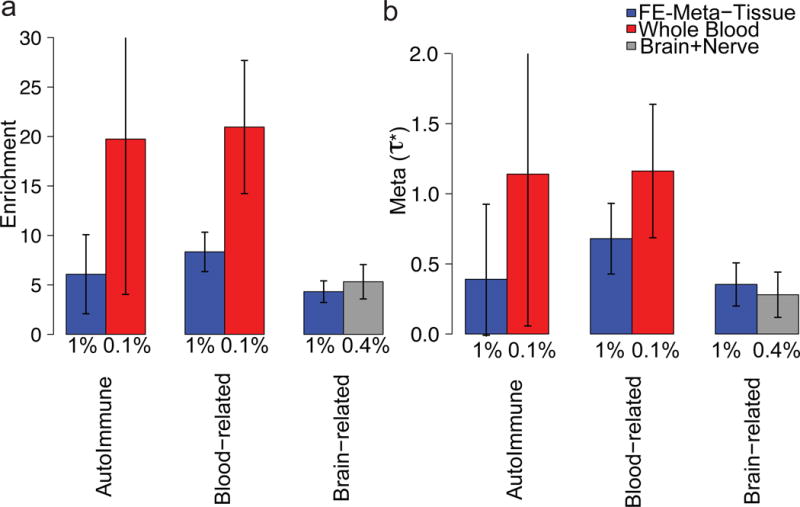
Figure 4. Tissue-specific fine-mapped eQTL enrichments for blood and brain related traits.

Meta-analysis results of (a) enrichment and (b) of FE-Meta-Tissue and tissue-specific MaxCPP annotations, conditional on each other and the baselineLD model, across six independent autoimmune diseases, five blood cell traits, and eight brain-related traits, respectively. The Y-axis is the meta-analyzed value and error bars represent 95% confidence intervals. The % value under each bar indicates the proportion of SNPs in each annotation, defined as the average value of the annotation. Numerical results are reported in Supplementary Table 13.
