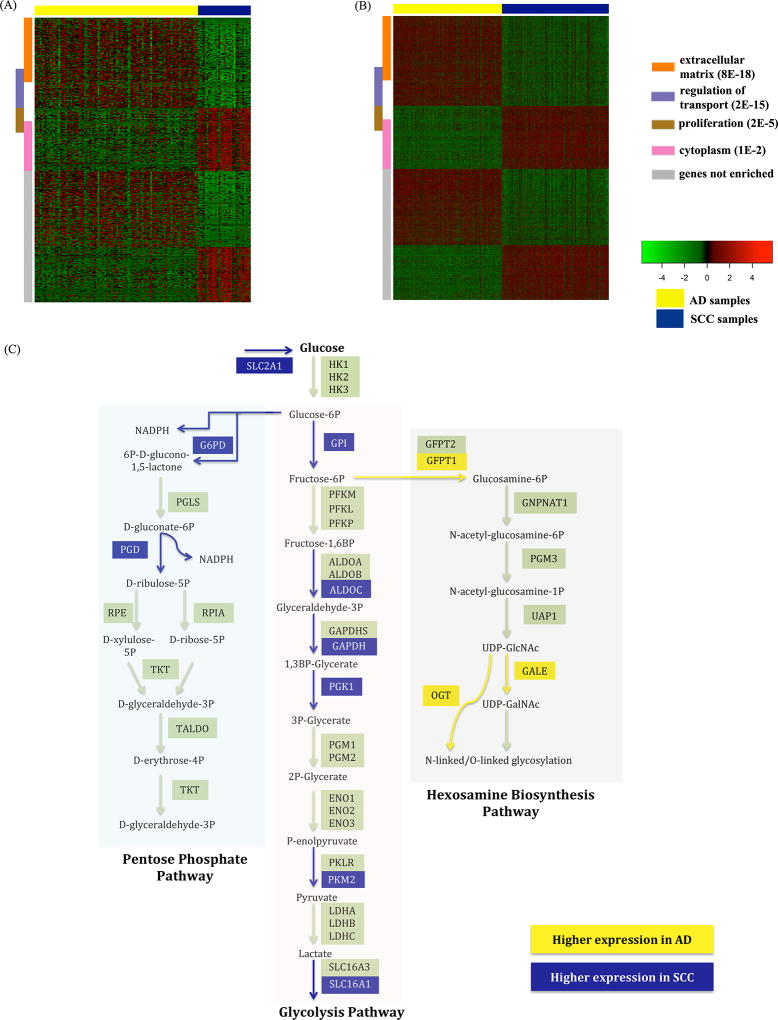
Figure 1.
Differentially expressed genes (DEGs) between AD and SCC. (A) Heatmap of DEGs between AD and SCC in the radiogenomics (RG) cohort. (B) Heatmap for TCGA showing only the DEGs derived from the radiogenomics cohort. Yellow denotes AD, and Blue denotes SCC samples. DEGs are annotated for enrichment of extracellular matrix (coral), regulation of transport related to invasion (lavender), proliferation (brown), cytoplasm (pink), or unassigned (grey). The enrichment FDRs are shown in parenthesis. (C) Glucose-driven metabolic pathways: glycolysis, pentose phosphate pathway and hexosamine biosynthesis pathway. All DEGs in the glucose metabolic pathways were differentially expressed in both RG cohort and TCGA, except for G6PD and PKM2 which were only differentially expressed in TCGA, and OGT which was only differentially expressed in the RG cohort.

