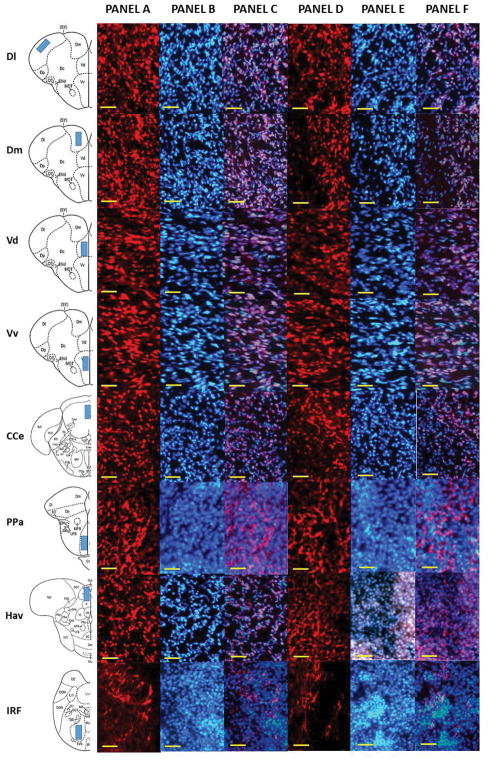
Figure 4.
Representative photomicrograph of different areas of adult zebrafish brain stained with anti-NCAM antibody. The first column of the figure displays a schematic diagram of the areas analyzed. Panel A depicts the anti-NCAM stained brain section of control fish (0% alcohol exposed), and Panel B depicts a DAPI stained brain section of the corresponding area. Panel C shows Panel A and B superimposed. Panel D depicts the anti-NCAM stained brain section of 1% alcohol exposed zebrafish, and Panel E depicts a DAPI stained brain section of the corresponding area. Panel F displays Panel D and E superimposed. The scale bar represents 10μm.

