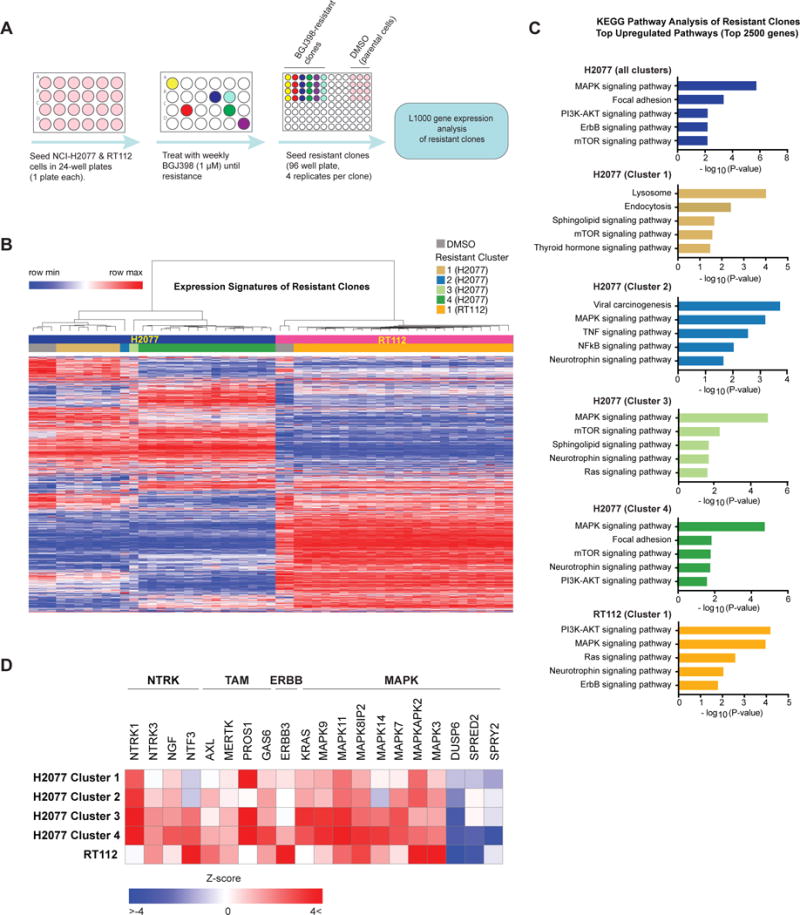
Figure 3. High-throughput generation and characterization of resistant FGFR-dependent cell lines.

A) Schematic overview of the experimental approach. NCI-H2077 and RT112 were seeded in separate 24-well plates and subjected to weekly treatment with BGJ398 1 μM until resistance. At that time, resistant clones were seeded in quadruplicate in 96 wells plate, and mRNA was isolated for gene expression analysis by the L1000 platform.
B) Unsupervised hierarchical clustering of gene expression profiles of all BGJ398-resistant clones of NCI-H2077 and RT112 and respective DMSO controls. Clustering yielded two large groups of BGJ398-resistant NCI-H2077 clones, and two additional small clusters with distinct profiles. RT112 formed a single large cluster.
C) Pathway enrichment analysis of resistant clones compared to controls using the Kyoto Encyclopedia of Genes and Genomes (KEGG) database. The top 2500 upregulated genes in each cluster were used for pathway enrichment analysis. Results were adjusted by multiple testing correction (Benjamini-Hochberg FDR) and signatures with adjusted p < 0.05 were considered statistically significant. Five significant results are shown per cluster.
D) Supervised analysis of gene expression of resistant clone clusters identified in Figure 3B, including several neurotrophin family receptors and their respective ligands, the TAM (TYRO3, MERTK, AXL) family members and their respective ligands, and positive and negative regulators of MAPK pathway.
