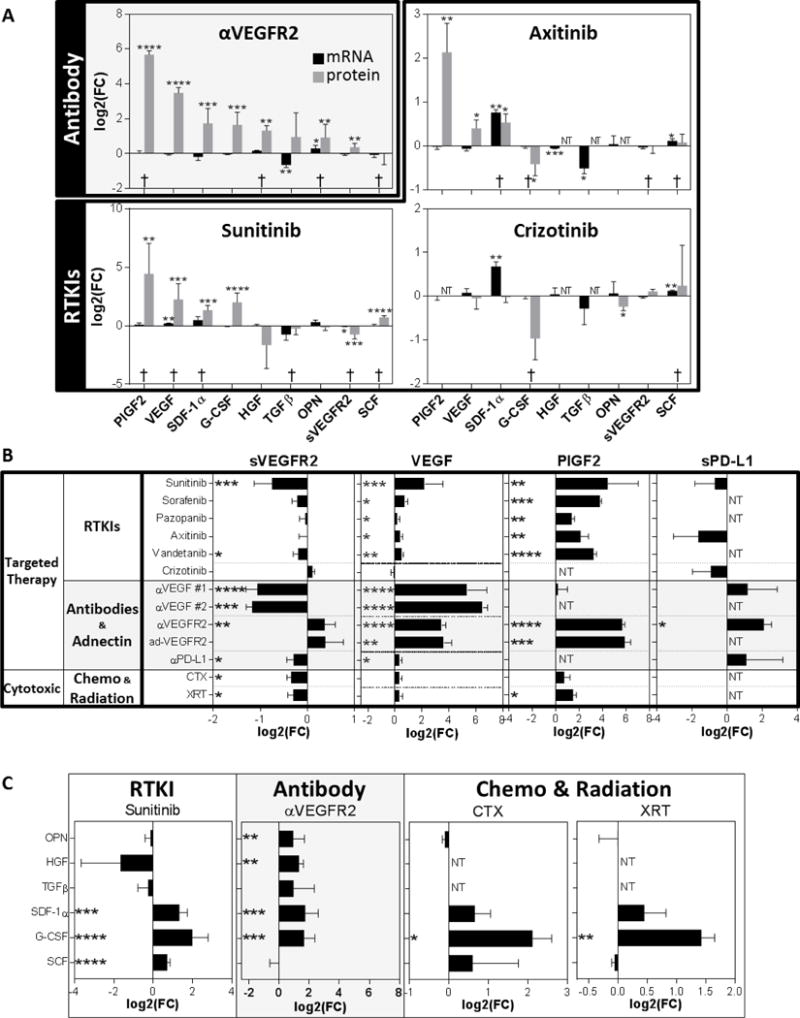
Figure 3. Host-mediated treatment-induced secretory gene changes are not always consistent with circulating protein changes.

Protein analysis for circulating factors after 7-day treatment with different cancer therapies (RTKI, Ab, Chemotherapy, and Radiation). (A) Bar graph showing mRNA and protein levels changes after treatment with an Ab or RTKIs (Balb/c mice; n=3 for mRNA from microarray data; n=3-10 for protein data). (B) Circulating protein levels for sVEGFR2, VEGF, PlGF-2, and sPD-L1 after treatment with targeted therapies (RTKI, Ab, or Adnectin) or Cytotoxic therapies (Chemotherapy or Radiation) (Balb/c mice; n=3-10). (C) Sunitinib, αVEGFR2, CTX, and XRT effect on multiple plasma proteins. Protein levels of OPN, HGF, TGFβ, SDF1α, and SCF in plasma are shown (Balb/c mice; n= 3-10; 7-day treatments). See Table S3 for drug treatment and dosing schedule. Drugs used: αVEGF #1 (G6.31), αVEGF #2 (B20), αVEGFR2 (DC101), adVEGFR2 (CT322), αPD-L1 (10F.9G2). NT, not tested; Bar graphs showing log2-fold changes (FC) compared to vehicle treated animals; * p<0.05, ** p<0.01, *** p<0.001, **** p<0.0001 indicate significance; †: similar change for both mRNA and protein levels.
