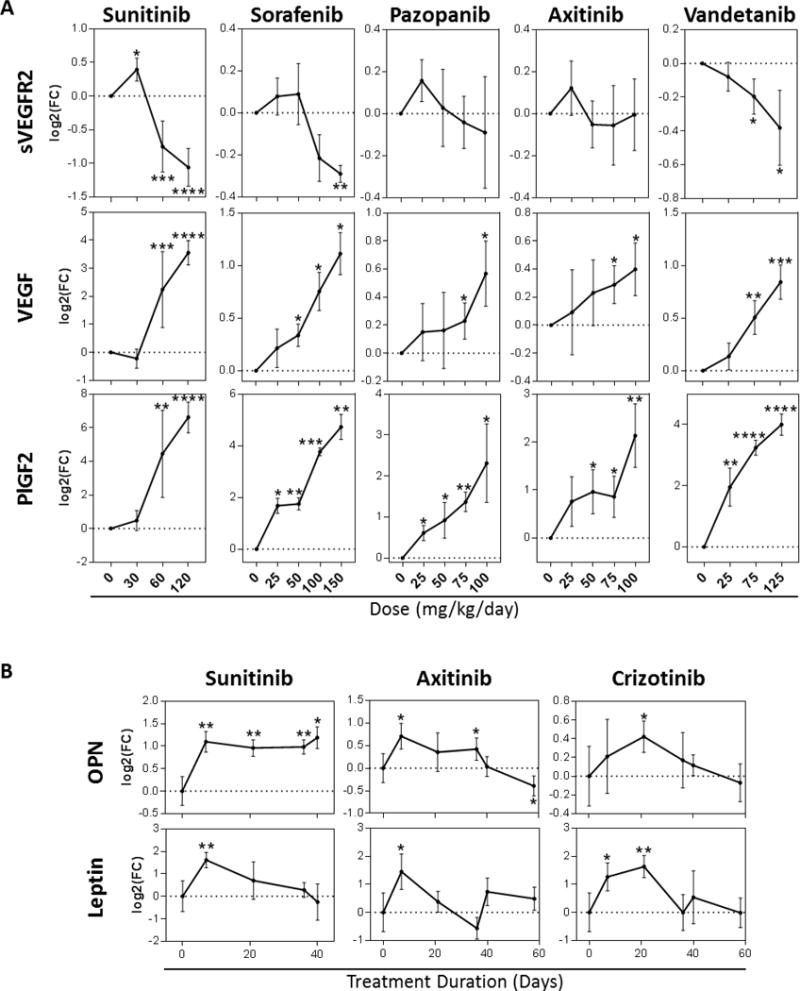
Figure 4. Drug dose and treatment duration impact host TIS.

(A) Protein levels of circulating sVEGFR2, VEGF, and PlGF2 after treatment with varying doses of Sunitinib, Sorafenib, Pazopanib, Axitinib, and Vandetanib (Balb/c mice; n= 3-16; 7-day treatment). (B) Plasma protein levels of OPN, and Leptin after chronic treatment with Sunitinib (40 days), Axitinib, and Crizotinib (58 days) (SCID mice; n= 3-11). * p<0.05, ** p<0.01, *** p<0.001, **** p<0.0001 compared to corresponding vehicle treated animals or baseline (Day 0). Note: Sunitinib data shown in Fig 4A for VEGF and sVEGFR-2 is an expansion of results published in Ebos et al., PNAS, 2007 and is shown here for comparative purposes.
