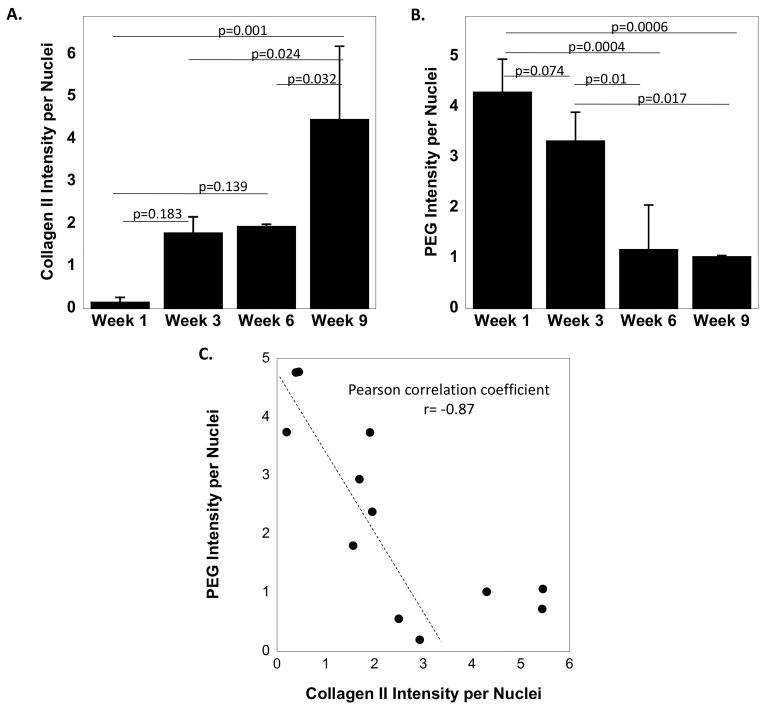
Figure 5.
Semi-quantitative analysis of immunohistochemical images of (A) collagen II intensity per nuclei and (B) PEG intensity per nuclei as a function of culture time. (C) A scatter plot of PEG intensity per nuclei plotted against collagen II intensity per nuclei. A linear correlation between PEG and collagen II intensity is shown with a linear Pearson correlation coefficient of -0.87. The data points above a value of four for collagen II intensity per nuclei were not included in the linear correlation.

