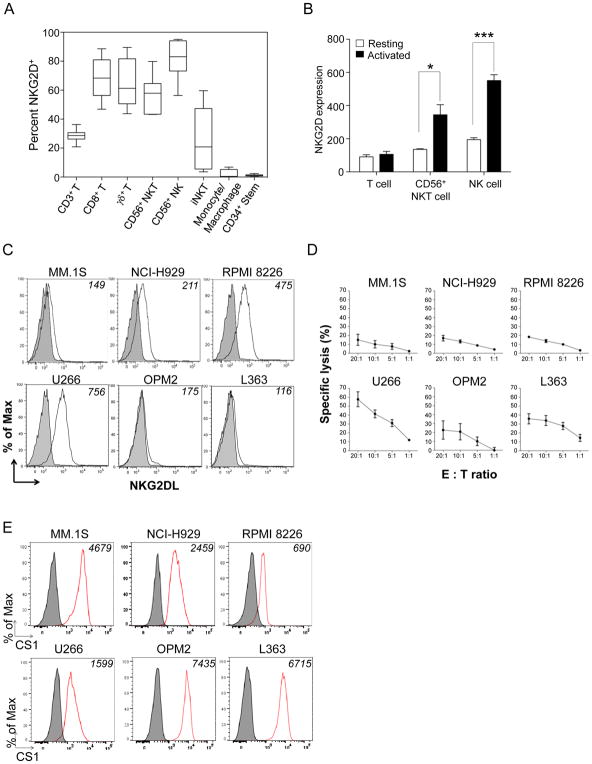
Figure 1. NKG2D, NKG2D ligands, and CS1 expression.
(A) Box-and-whisker plot of percent NKG2D+ cells in peripheral blood immune cells. Data represent the median percent among 5 healthy donors. (B) Expression of NKG2D on T cells, CD56+ NKT cells, and NK cells at rest or overnight IL2-activated conditions. Results are mean MFI±S.E.M. from three independent experiments. *p<0.05; ***p<0.001 using Student’s t test. (C) The expression NKG2D ligands (white) on MM cell lines stained with NKG2D-Fc antibody compared to the isotype (grey). Numbers on the top right corner: mean fluorescent intensity (MFI). Results are from one representative of three independent staining experiments. (D) NK cell natural cytotoxicity against MM.1S, NCI-H929, RPMI-8226, OPM2, and L363 cells. Target cells were co-incubated with NK cells at indicated effector-to-target (E:T) ratios for 4 hours. Results are mean specific lysis with S.E.M. from three independent experiments and 3 healthy donors. (E) Expression of CS1 on different MM cells displayed as histograms compared to isotype. Numbers on the top right corner: MFI. Results are from one representative of three independent staining experiments.

