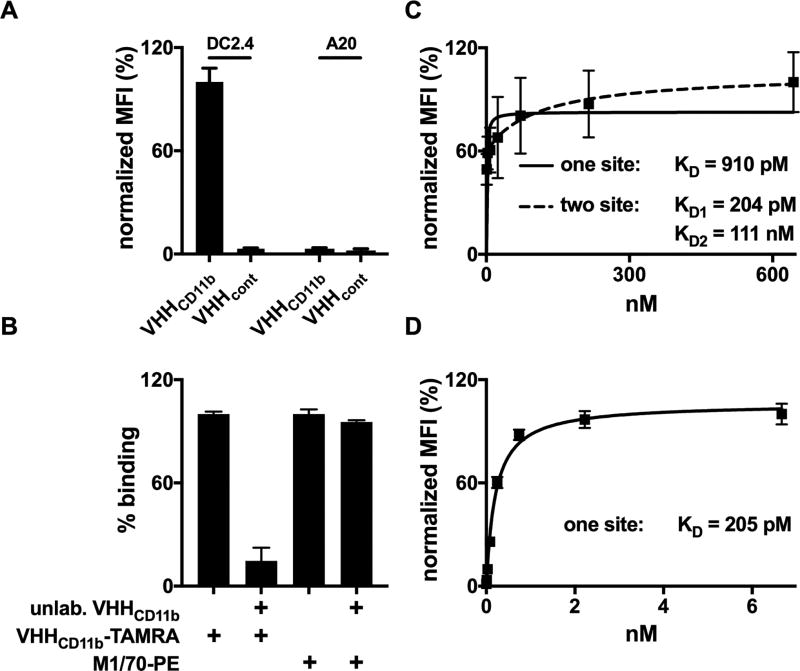
Figure 2.
Binding of VHHCD11b to CD11b+ cells. A) CD11b+ DC2.4 cells or CD11b− A20 cells were incubated with TAMRA-labeled VHHCD11b or VHHcont (anti-GFP control VHH). The mean fluorescence intensity (MFI) as assessed by cytofluorimetry was normalized to the average maximum observed MFI of VHHCD11b-TAMRA on DC2.4 cells. B) DC2.4 cells were pre-incubated with unlabeled VHHCD11b (10 µg/mL) for 30 min at 4°C, and then stained with VHHCD11b-TAMRA or M1/70-PE for 30 min at 4°C. MFI was assessed via cytofluorimetry and binding was normalized to those observed with VHHCD11b-TAMRA (left 2 columns) or M1/70-PE (right 2 columns). C–D) DC2.4 cells were incubated with different concentrations of VHHCD11b-TAMRA (C) or M170-PE (D) for and 30 min at 4°, and the MFI as assessed by cytofluorimetry was normalized to the maximum observed MFI for VHHCD11b-TAMRA or M170-PE, respectively. One-site (solid) or two-site (dashed) hyperbolic binding models were then used to calculate relative KD values. All data shown are representatives of at least two independent experiments performed in triplicate (mean ± SD).

