
Figure 2.
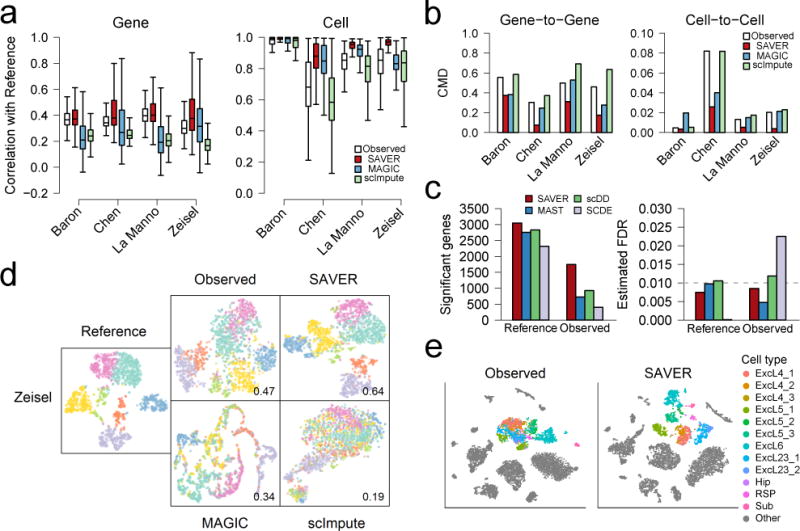
Evaluation of SAVER by down-sampling and cell clustering. (a) Performance of algorithms measured by correlation with reference, on the gene level (left) and on the cell level (right). Number of genes and cells can be found in Supplementary Table 3. Box plots show the median (center line), interquartile range (hinges), and 1.5 times the interquartile range (whiskers); outlier data beyond this range are not shown. (b) Comparison of gene-to-gene (left) and cell-to-cell (right) correlation matrices of recovered values with the true correlation matrices, as measured by correlation matrix distance (CMD). (c) Differential expression (DE) analysis between CA1Pyr1 cells (n = 351) and CA1Py2 cells (n = 389) showing significant genes detected at FDR = 0.01 (left) and estimated FDR (right). (d) Cell clustering and t-SNE visualization of the Zeisel dataset (n = 1,799). Jaccard index of the down-sampled observed dataset and recovery methods as compared to the reference classification is shown. (e) t-SNE visualization of 7,387 mouse cortex cells for the observed data (left) and SAVER (right) colored by cell types determined by Hrvatin et al.