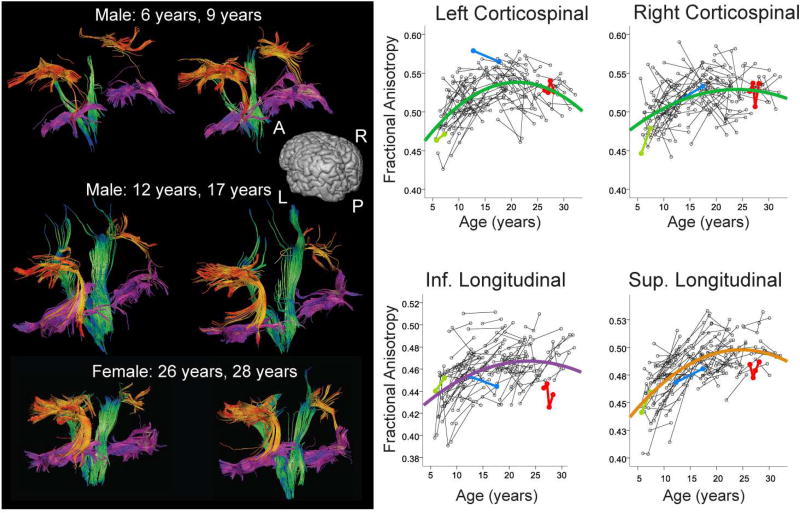
Figure 5.
Individual tractography results for the superior longitudinal fasciculus (orange), inferior longitudinal fasciculus (magenta), and corticospinal tracts (green) are shown in three representative healthy individuals at different ages. The whole dataset is shown in scatterplots at right, with data from the individuals shown at left identified in colour. The scatter plots show later maturation in the superior longitudinal fasciculus compared to the other regions. Ages of peak FA values were 21 and 23 years for the left and right corticospinal tracts, and 24 and 25 years for the inferior and superior longitudinal fasciculi, respectively. Figure is adapted from Lebel and Beaulieu 2011.

