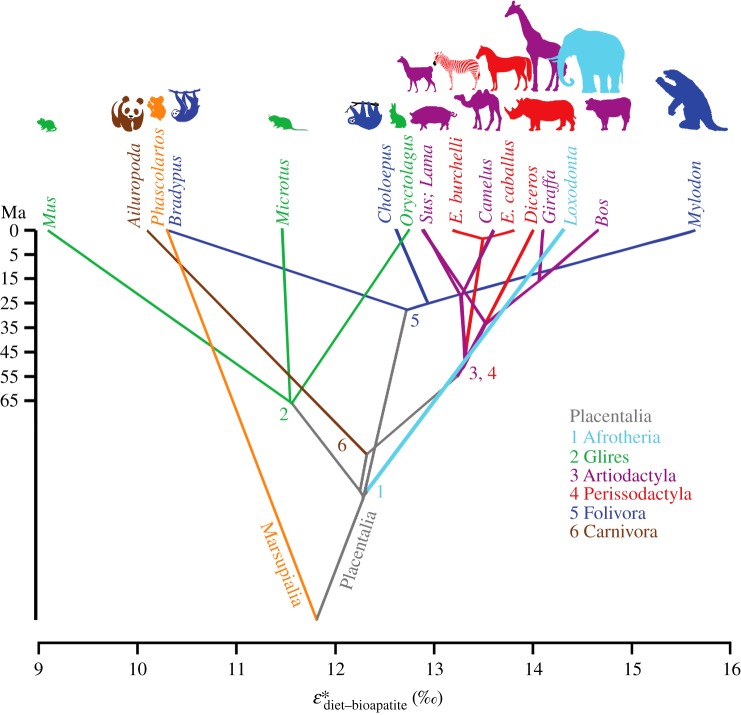
Figure 1.
Mammalian phylogenetic tree for sampled herbivores, mapped in a space defined by δ13C diet-bioapatite enrichment  . Colours represent clades (see the electronic supplementary material). Note the extremely large range of
  variation in Folivora (sloths), spanning almost the entire spectrum of variation observed in Mammalia. Animal silhouettes are for reference and not to scale.

