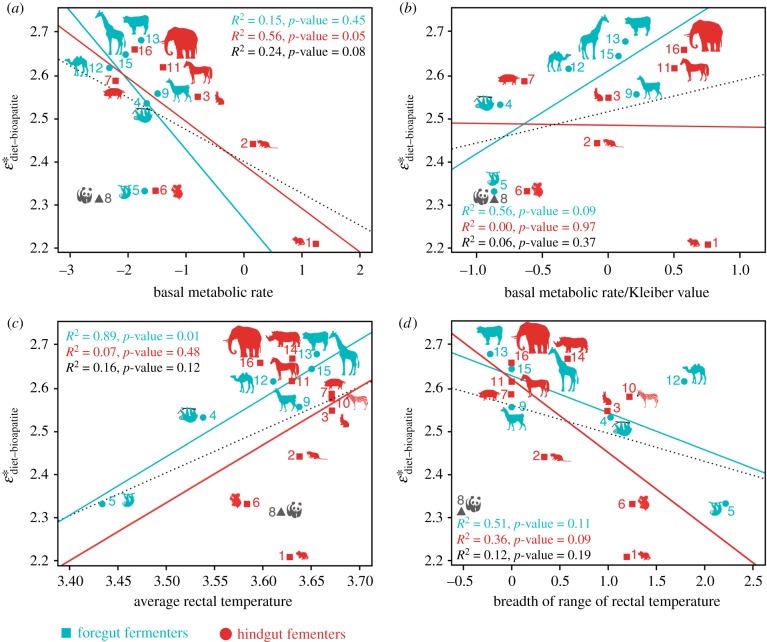
Figure 3.
Correlations between  and different life-history traits. (a) Basal metabolic rate (BMR). (b) BMR, after adjusting for the body mass component of the measured BMR (BMR/Kleiber value). The body mass component was removed by adjusting the BMR to a value corresponding to 3.42*BM−0.25 (i.e. the Kleiber value [22]), indicating the scaling of the BMR relative to the body mass for mammals (body mass in grams [23]). (c) Average rectal temperature and (d) breadth of range of rectal temperature. All values in natural logarithmic scale. Temperature in °C. Dotted black line is the regression model for all taxa included; the red and greenish lines are the regression models for hindgut and foregut fermenters, respectively. Numbers for taxa same as in figure 2.

