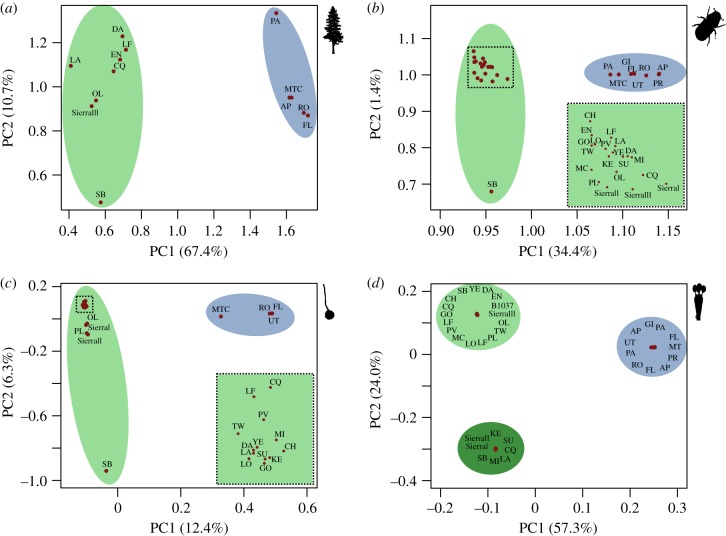
Figure 3.
Fine-scale population structuring and relationships among sites. Results of PCA for the (a) tree, (b) beetle and symbiotic, (c) ascomycete and (d) basidiomycete. Highlighted in green are West sites, and in blue are East sites. Colours correspond to those used in figure 2b. Dense clusters of points are highlighted in boxes and expanded in the bottom right.

