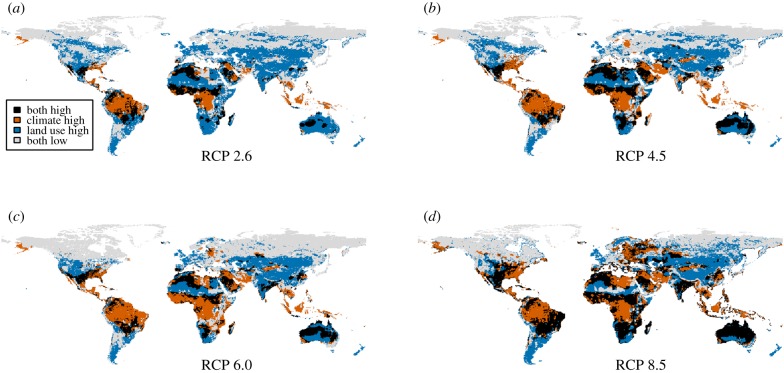
Figure 4.
Spatial patterns of biodiversity loss from climate and land-use change by 2070. Areas with more than 10% net loss of species from climate change are shown in brown; areas with more than 10% loss of species from land-use change in blue; areas where more than 10% losses from each pressure overlap are shown in black; and areas with less than 10% losses from both pressures are shown in grey. Projections are shown for each of the socio-economic and greenhouse-gas-emission scenarios: (a) RCP 2.6; (b) RCP 4.5; (c) RCP 6.0 and (d) RCP 8.5. Results for both land-use and climate impacts are based on the final projections at a spatial resolution of 0.5°.

