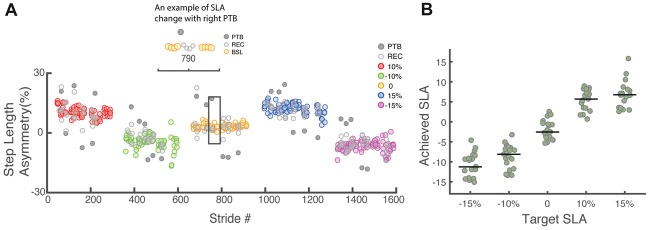
Figure 4.
(A) Raw step length asymmetry data for one representative participant. Each data point represents the step length asymmetry. The target asymmetries for this example followed the order of 10%, −10%, 0, 15%, −15%. Each target asymmetry is represented by a different color. BSL: baseline step; PTB: perturbation step; REC: recovery step. (B) Achieved step length asymmetry vs. target step length asymmetry for all participants (N = 19). Achieved step length asymmetry is calculated as the average of all pre-perturbation strides and tends to undershoot the target at 15% and −15%. The green dots represent individual data. Horizontal bars indicate the median across all participants.

