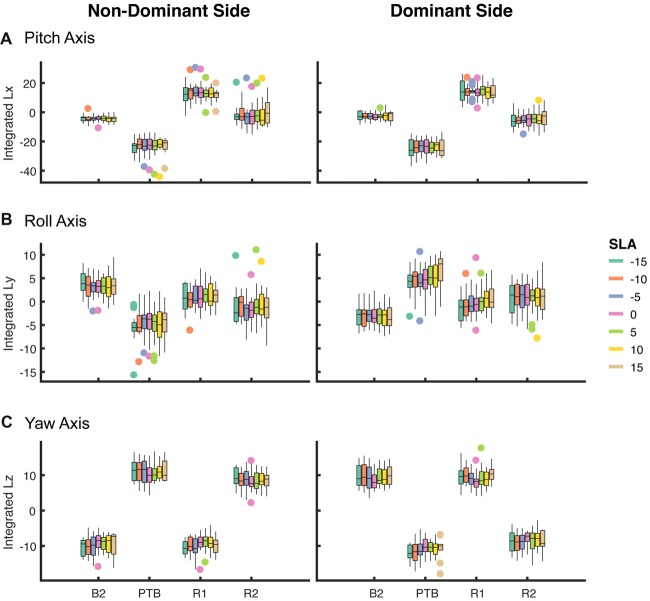
Figure 6.
Box plot of integrated angular momentum about the (A) pitch, (B) roll and (C) yaw axes at baseline step (B2), perturbation step (PTB) and recovery steps (R1 and R2) across each level of achieved asymmetry (N = 19) for perturbations on the non-dominant (left column) and dominant (right column) sides.

