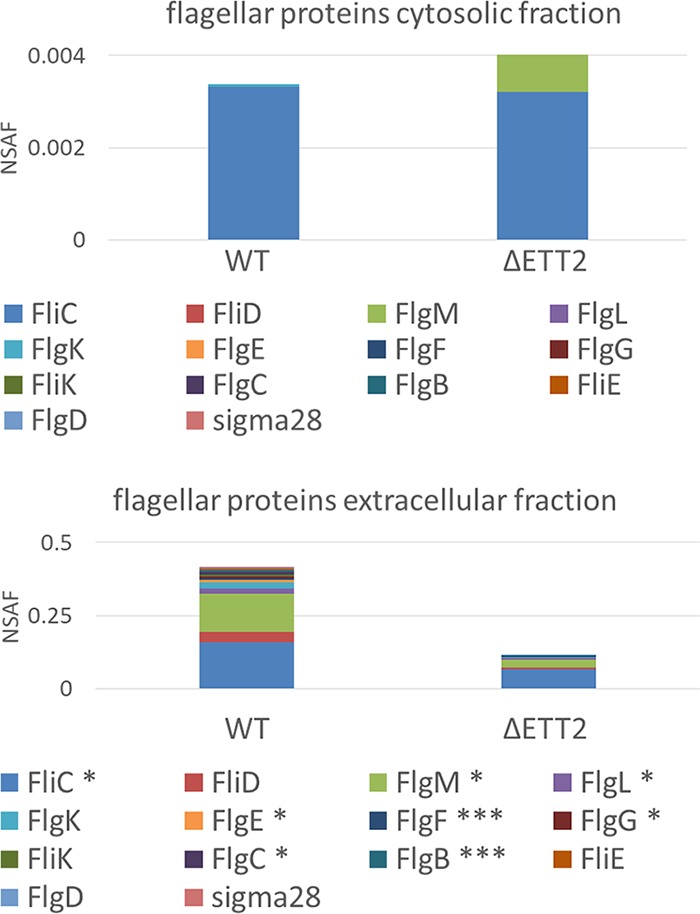
FIG 3 .

Distribution of flagellar proteins between the cytosol and the secretome of the wild type (WT) and the ΔETT2 mutant strains. Proteomic quantity calculation was carried out using the normalized spectral abundance factor (NSAF) (41). The asterisks depict statistical significance of WT versus ΔETT2: *, P = 0.05; ***, P = 0.01.
