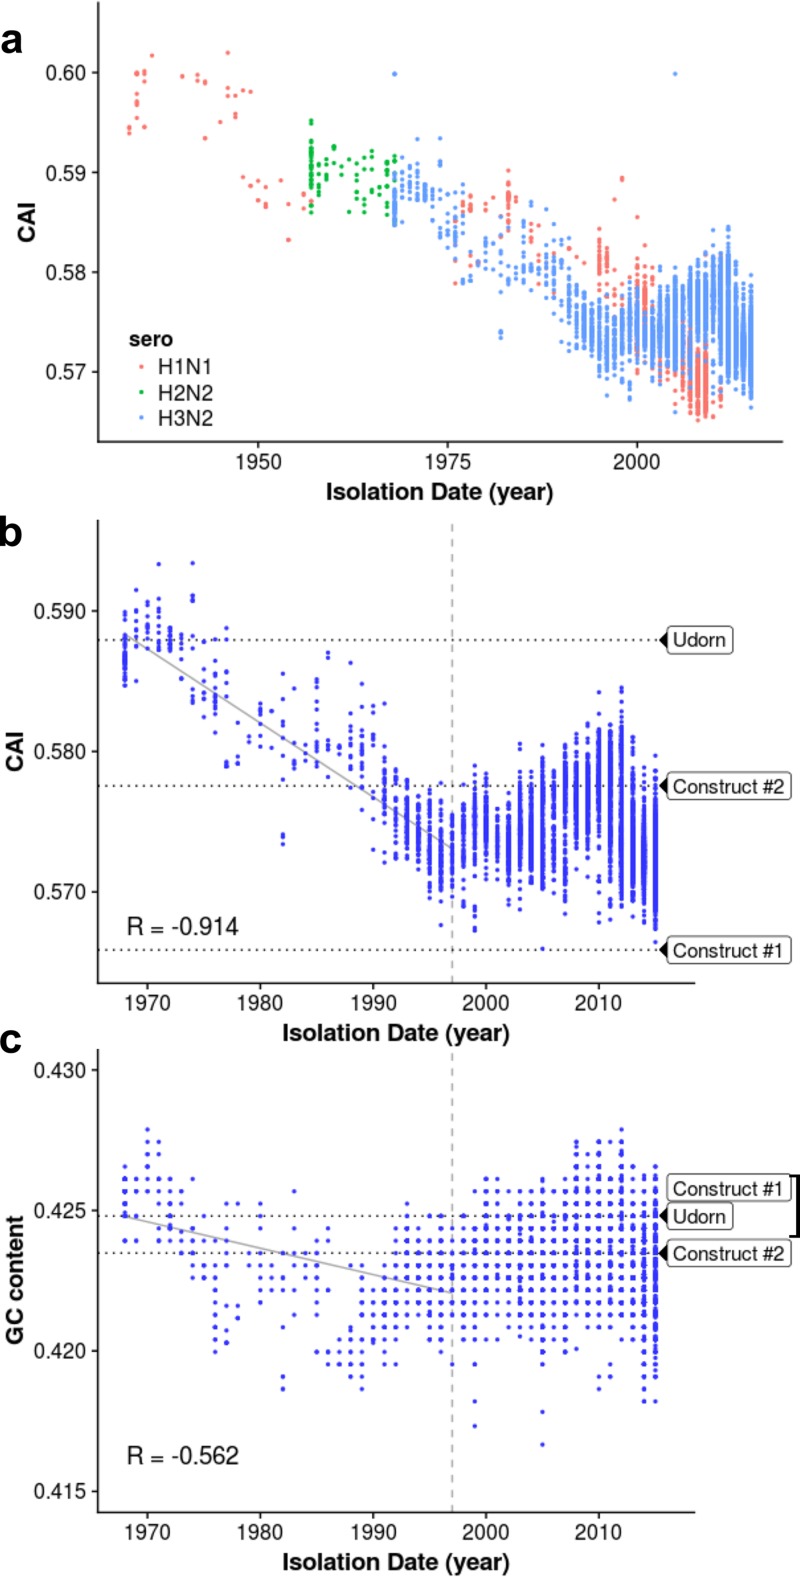
FIG 1 .
The CAI values of PB1 mRNAs of H1N1, H2N2, and H3N2 influenza A viruses show a decline over time after the introduction of the avian influenza virus PB1 segment into a human-infecting virus in 1968. (a) CAI values of PB1 mRNAs of H1N1, H2N2, and H3N2 influenza A viruses and of influenza B virus plotted against year of isolation since 1968. (b) CAI values of PB1 mRNAs of H3N2 viruses plotted against year of isolation. The CAI values of WT Ud virus and the two codon-altered Ud viruses are shown. The horizontal dotted lines represent the linear regression across the first 30 years of circulation, and the 30-year mark is denoted by the dashed vertical line. The P value of the linear regression, determined by the reshuffling test described in the text, is 0.017. (c) GC content of PB1 mRNAs of H3N2 viruses plotted against circulation time. The GC content of WT Ud virus and the two codon-altered Ud viruses is shown. The horizontal dotted lines represent the linear regression across the first 30 years of circulation, and the 30-year mark is denoted by the dashed vertical line. The P value of the linear regression, determined by the reshuffling test, is 0.509. See Fig. S1.

