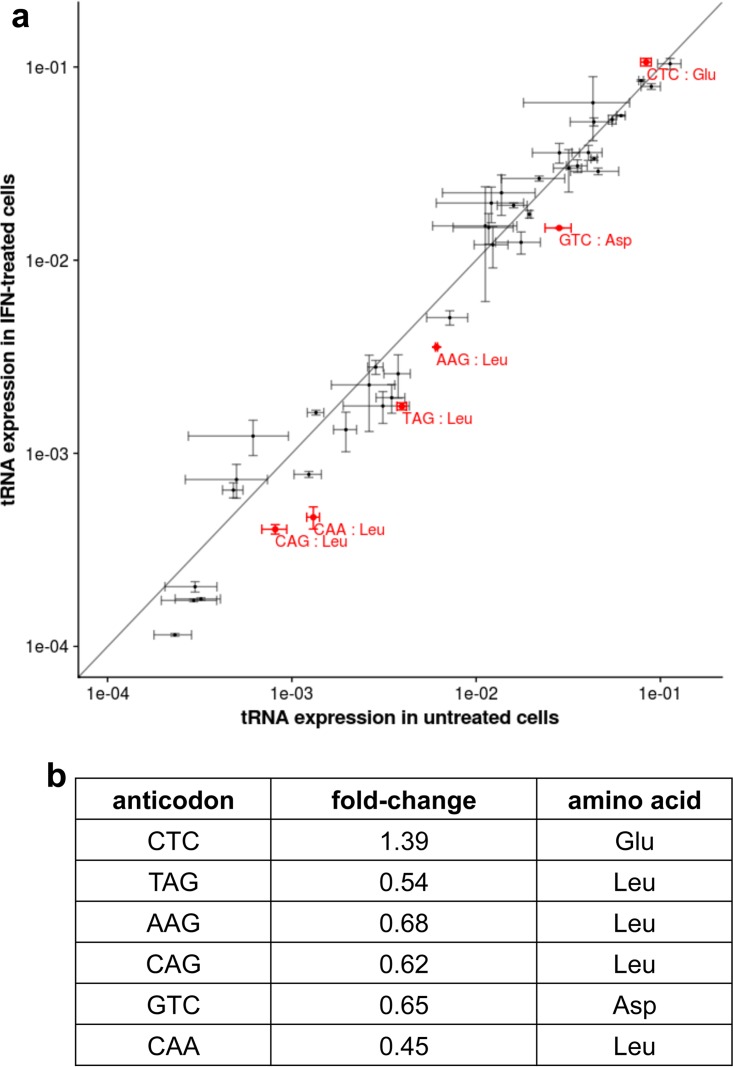
FIG 3 .
Levels of different tRNAs in IFN-treated human A549 cells compared to the tRNA levels in untreated cells. (a) Mean of the log of the proportion of total tRNAs of each tRNA anticodon in untreated cells versus the log proportion of total tRNAs in IFN-treated cells across three replicates. Error bars indicate standard errors. Six anticodons (marked in red) showed a statistically significant difference between untreated and IFN-treated cells (P [adjusted] < 0.05) using DESeq2. The solid line shows the values corresponding to tRNA anticodons that were present in equal amounts in IFN-treated and untreated cells. (b) Fold change in the six tRNA anticodons that differed significantly (adjusted P < 0.05) between IFN-treated and untreated cells, shown with their encoded amino acid.

