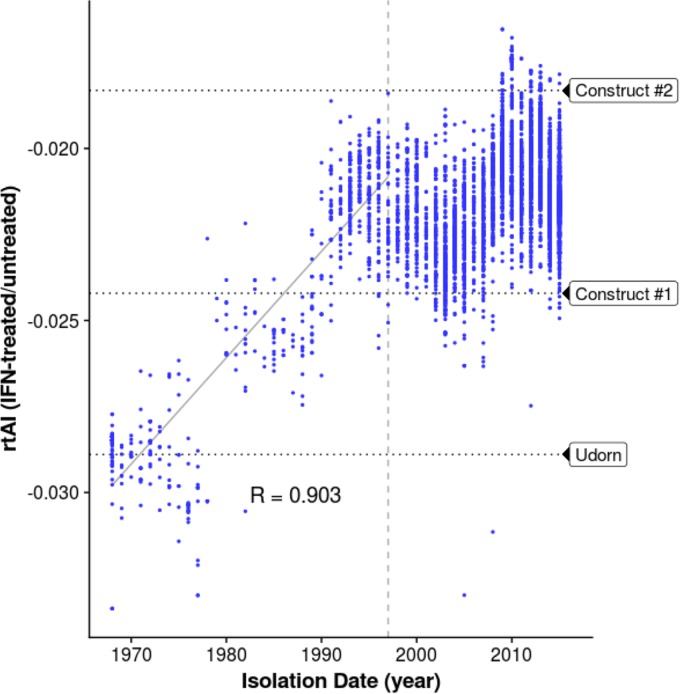
FIG 4 .
The rtAI values of H3N2 PB1 mRNAs for IFN-treated human cells versus untreated cells increased over time after 1968. The rtAI values for the two codon-altered virus constructs and WT Ud virus are shown. The horizontal dotted lines represent the linear regression across the first 30 years of circulation, and the 30-year mark is denoted by the dashed vertical line. The P value of the linear regression, determined by the reshuffling test, is 0.046. See Fig. S2.

