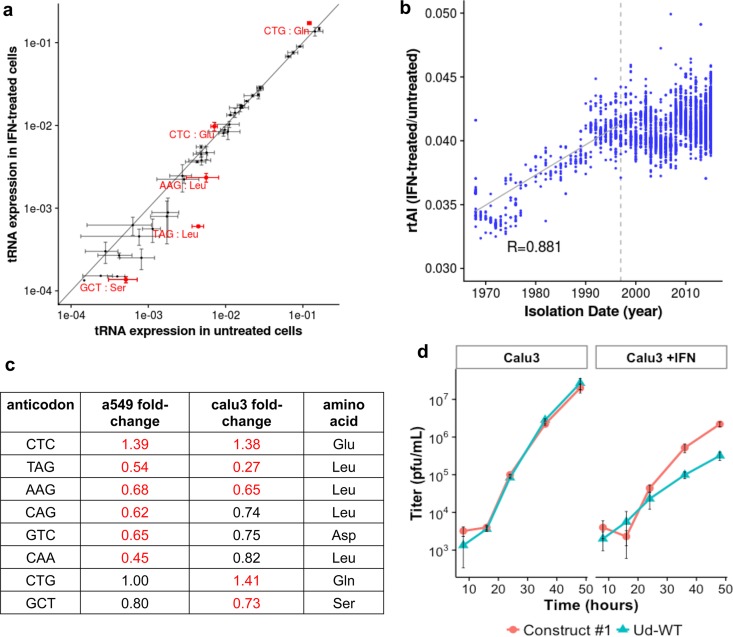
FIG 6 .
Calu3 cells display a change in synonymous codon usage after IFN treatment consistent with the findings in A549 cells. (a) Proportion of total tRNAs of each tRNA anticodon in untreated cells versus the proportion of total tRNAs in IFN-treated cells. Means are reported with error bars indicating standard errors. Six anticodons (marked in red) show a statistically significant difference between untreated and IFN-treated cells (P [adjusted] < 0.05) by DESeq2. (b) The rtAI values, based on quantification of Calu3 tRNA pools, for H3N2 PB1 mRNAs over time. The diagonal solid line represents the linear regression across the first 30 years of circulation, and the 30-year mark is denoted by the dashed vertical line. The P value of the linear regression, determined by the reshuffling test, is 0.056. (c) The fold change in tRNA availability due to IFN treatment for all anticodons found to be statistically significant by DESeq in either A549 or Calu3 cells. Red letters indicate that the anticodon was found to be significantly different (P adjusted < 0.05) in the indicated cell line. (d) Growth curves, from experiments carried out in triplicate, of construct 1 and WT Ud in Calu3 cells infected at a MOI of 0.01. Mean titers are reported with error bars indicating standard errors.

