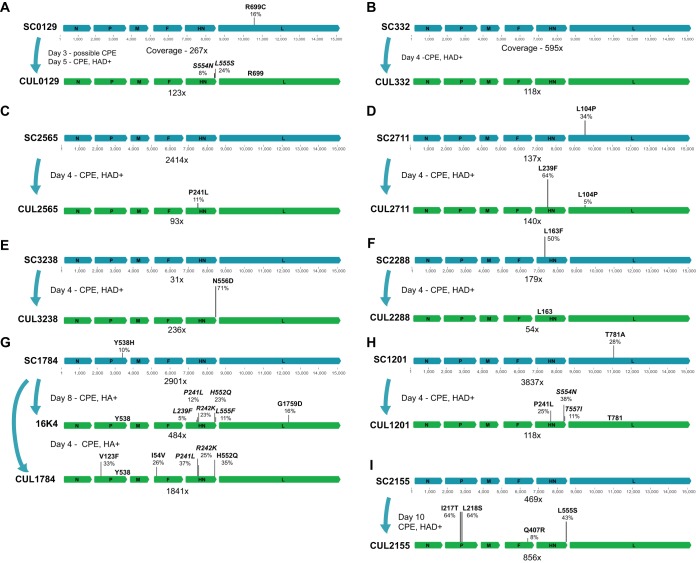
FIG 1 .
Mutational changes and allele frequencies in matched clinical samples and cultures. Blue genomes represent clinical samples, and the green genomes below the blue genomes represent the same sample after it was inoculated into culture and harvested several days later. The number of days cultured, hemagglutinin adsorption assay results (HAD), and observed cytopathic effect (CPE) are shown for each viral isolate. Virus from sample SC1784 in panel G was isolated twice. Coverage is averaged across the entire genome and depicted underneath each genome. Allele frequencies are plotted to scale above the genome organization. Mutational changes are described relative to the amino acid in the consensus genome of the original patient sample. Variants indicated in italics were found exclusively on separate reads and are considered unlinked.

